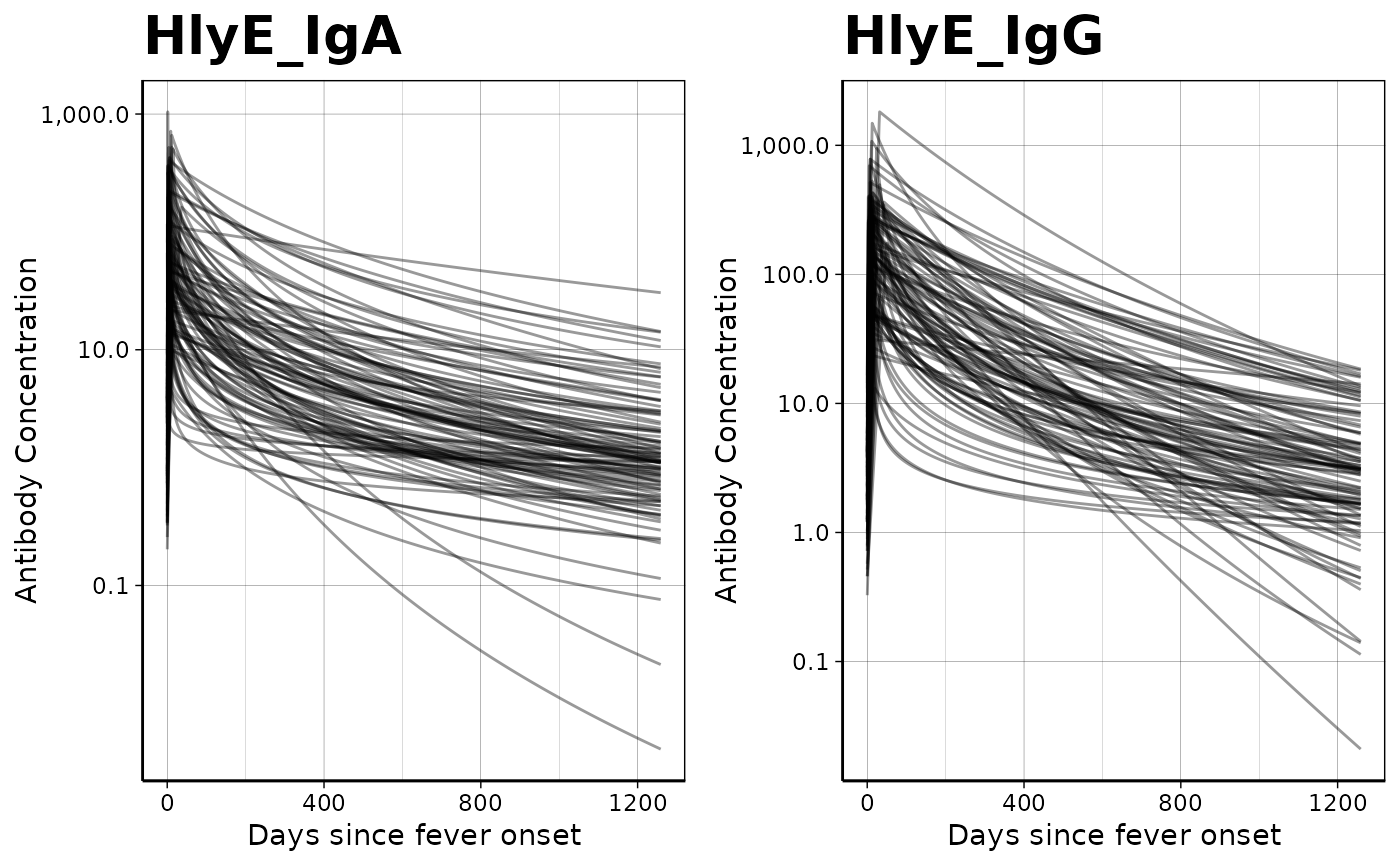
graph antibody decay curves by antigen isotype
Source:R/autoplot.curve_params.R
autoplot.curve_params.Rdgraph antibody decay curves by antigen isotype
Arguments
- object
a
data.frame()of curve parameters (one or more MCMC samples)- antigen_isos
antigen isotypes to analyze (can subset
curve_params)- ncol
how many columns of subfigures to use in panel plot
- ...
-
Arguments passed on to
plot_curve_params_one_abverboseverbose output
xlimrange of x values to graph
n_curveshow many curves to plot (see details).
n_pointsNumber of points to interpolate along the x axis (passed to
ggplot2::geom_function())rows_to_graphwhich rows of
curve_paramsto plot (overridesn_curves).alpha-
(passed to
ggplot2::geom_function()) how transparent the curves should be:0 = fully transparent (invisible)
1 = fully opaque
log_xshould the x-axis be on a logarithmic scale (
TRUE) or linear scale (FALSE, default)?log_yshould the Y-axis be on a logarithmic scale (default,
TRUE) or linear scale (FALSE)?
Value
a ggplot2::ggplot() object
Details
rows_to_graph
Note that if you directly specify rows_to_graph when calling this function,
the row numbers are enumerated separately for each antigen isotype;
in other words, for the purposes of this argument,
row numbers start over at 1 for each antigen isotype. There is currently
no way to specify different row numbers for different antigen isotypes;
if you want to do that, you could call plot_curve_params_one_ab()
directly for each antigen isotype and combine the resulting panels yourself.
Or you could subset curve_params manually, before passing it to this
function, and set the n_curves argument to Inf.
Examples
# \donttest{
library(dplyr)
#>
#> Attaching package: ‘dplyr’
#> The following objects are masked from ‘package:stats’:
#>
#>     filter, lag
#> The following objects are masked from ‘package:base’:
#>
#>     intersect, setdiff, setequal, union
library(ggplot2)
library(magrittr)

curve <-
  serocalculator_example("example_curve_params.csv") %>%
  read.csv() %>%
  as_curve_params() %>%
  filter(antigen_iso %in% c("HlyE_IgA", "HlyE_IgG")) %>%
  autoplot()

curve

# }
# }