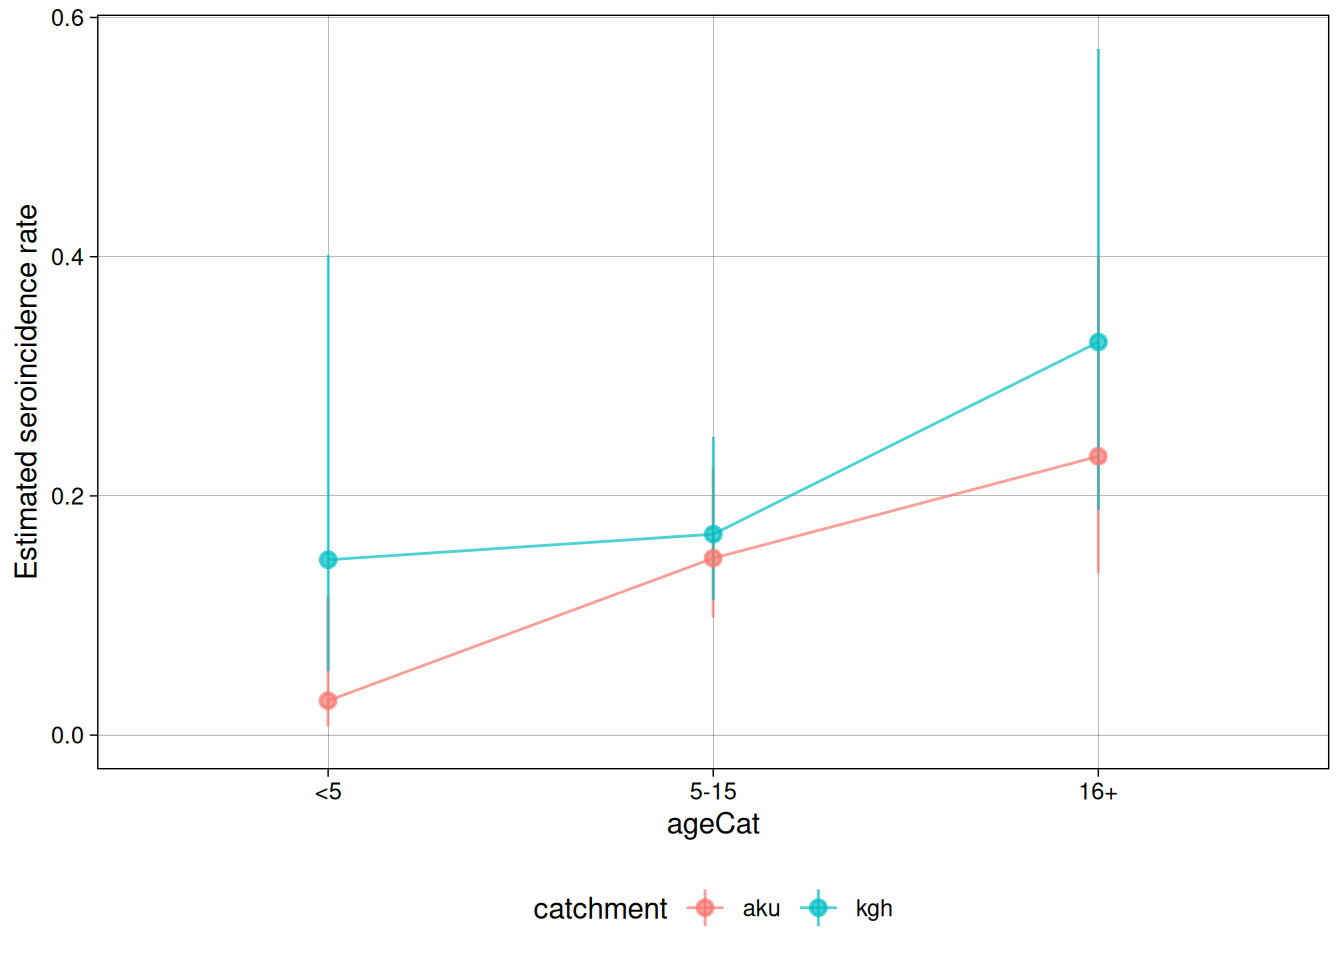
Scatterplot method for summary.seroincidence.by objects

Description

Scatterplot method for summary.seroincidence.by objects

Usage

strat_ests_scatterplot(
  object,
  xvar = strata(object)[1],
  alpha = 0.7,
  shape = 1,
  dodge_width = 0.001,
  CIs = FALSE,
  color_var = "nlm.convergence.code",
  group_var = NULL,
  ...
)

Arguments

object a summary.seroincidence.by object (generated by applying the summary() method to the output of est_seroincidence_by()).
xvar the name of a stratifying variable in object
alpha transparency for the points in the graph (1 = no transparency, 0 = fully transparent)
shape shape argument for geom_point()
dodge_width width for jitter
CIs logical, if TRUE, add CI error bars
color_var character which variable in object to use to determine point color
group_var character which variable in object to use to connect points with lines (NULL for no lines)
unused

Value

a ggplot2::ggplot() object

Examples

Code
library("serocalculator")

library(dplyr)
library(ggplot2)

xs_data <-
  sees_pop_data_pk_100

curve <-
  typhoid_curves_nostrat_100 |>
  filter(antigen_iso %in% c("HlyE_IgA", "HlyE_IgG"))

noise <-
  example_noise_params_pk

est2 <- est_seroincidence_by(
  strata = c("catchment", "ageCat"),
  pop_data = xs_data,
  sr_params = curve,
  noise_params = noise,
  curve_strata_varnames = NULL,
  noise_strata_varnames = NULL,
  antigen_isos = c("HlyE_IgG", "HlyE_IgA"),
  num_cores = 2 # Allow for parallel processing to decrease run time
)

est2sum <- summary(est2)

strat_ests_scatterplot(est2sum,
                       xvar = "ageCat",
                       color_var = "catchment",
                       CIs = TRUE,
                       group_var = "catchment")