Code
library("serocalculator")
plot_decay_curve(antibody_decay_curve)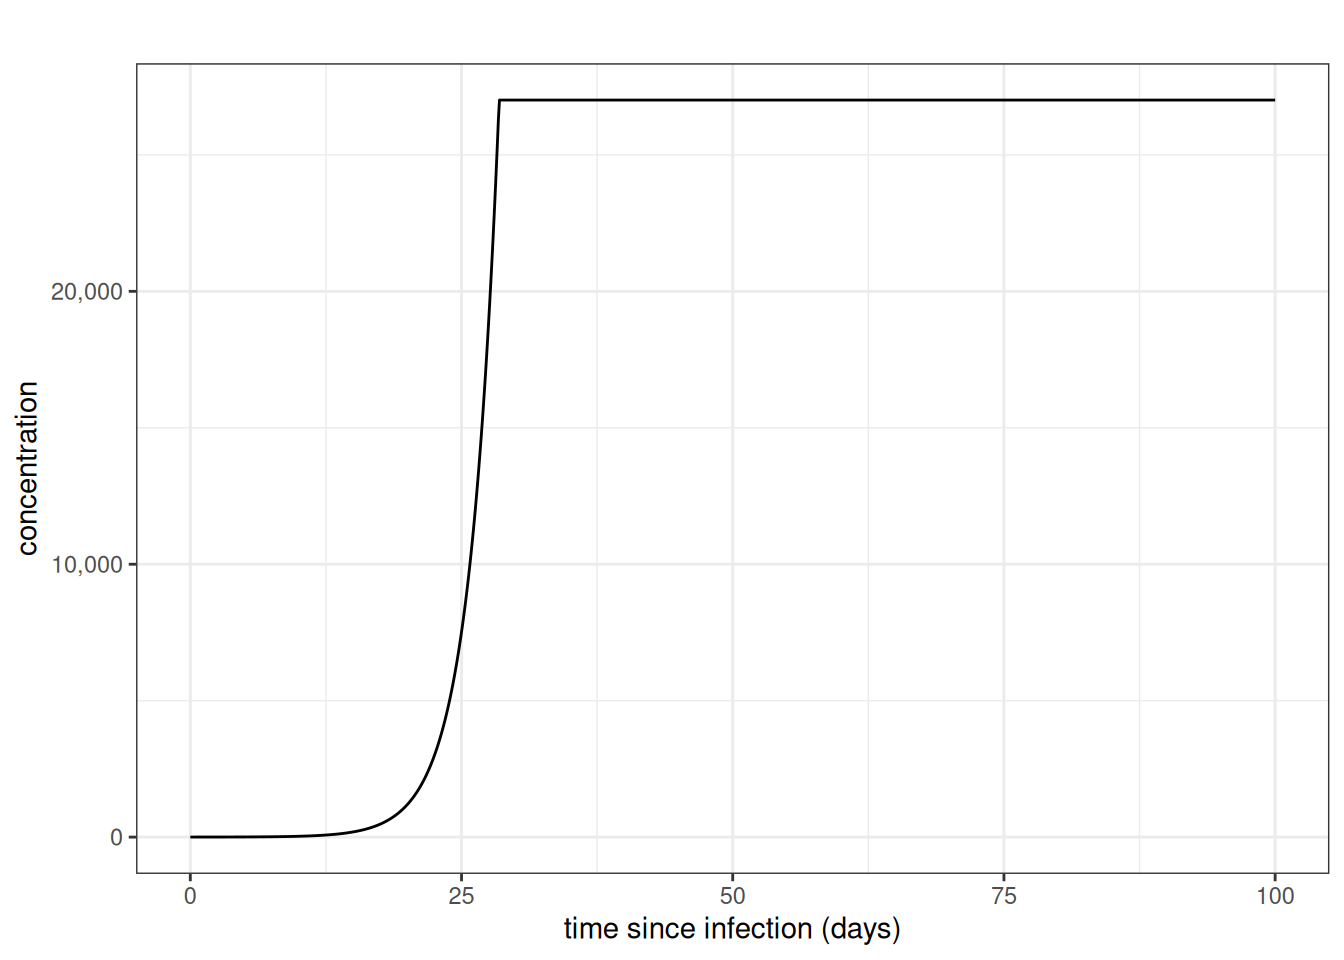
Plot a decay function
plot_decay_curve(
  decay_function = antibody_decay_curve,
  ...,
  xmax = 100,
  ymax = NA,
  title = ""
)
decay_function
|
a function with first argument t
|
…
|
parameters passed to decay_function
|
xmax
|
upper limit of x axis |
ymax
|
upper limit of y axis |
title
|
plot title |
a ggplot2::ggplot
library("serocalculator")

plot_decay_curve(antibody_decay_curve)