Code
library("serocalculator")
library(ggplot2)
ggplot() + geom_function(
fun = pathogen_decay_curve,
args = list(
y0 = 0.74916052,
b0 = 1,
mu_b = 0.18432798,
mu_y = 0.36853621,
gamma = 0.0013040664
)
) + xlim(0, 100)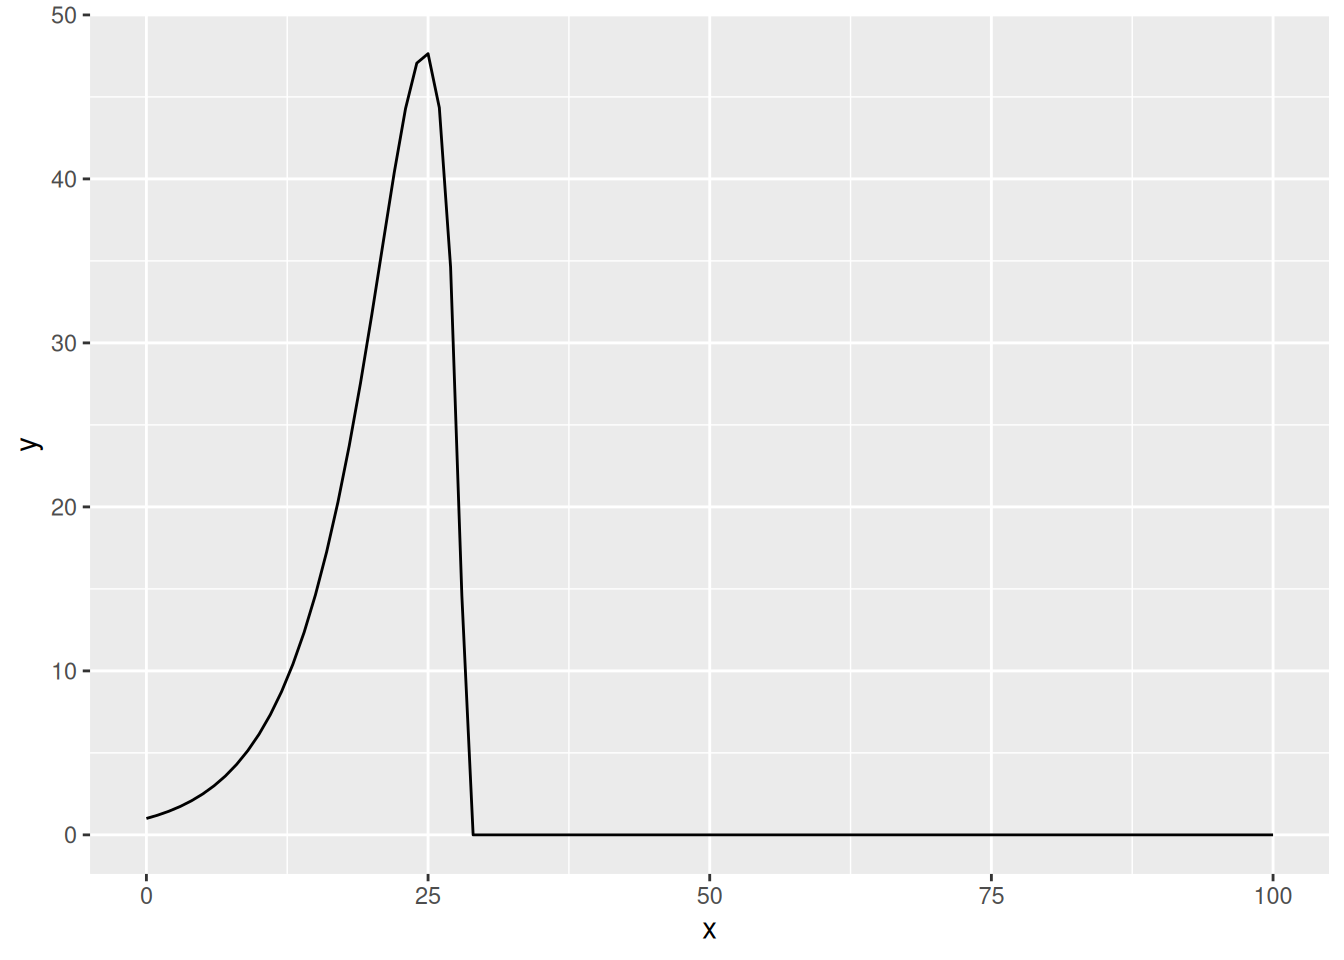
Pathogen decay curve
pathogen_decay_curve(
  t,
  y0 = 0.74916052,
  b0 = 1,
  mu_b = 0.18432798,
  mu_y = 0.36853621,
  gamma = 0.0013040664
)
t
|
time since infection |
y0
|
initial antibody concentration |
b0
|
initial bacteria concentration |
mu_b
|
pathogen reproduction rate |
mu_y
|
antibody reproduction rate |
gamma
|
bacteria destruction rate per antibody |
library("serocalculator")

library(ggplot2)
ggplot() + geom_function(
  fun = pathogen_decay_curve,
  args = list(
    y0 = 0.74916052,
    b0 = 1,
    mu_b = 0.18432798,
    mu_y = 0.36853621,
    gamma = 0.0013040664
  )
) + xlim(0, 100)