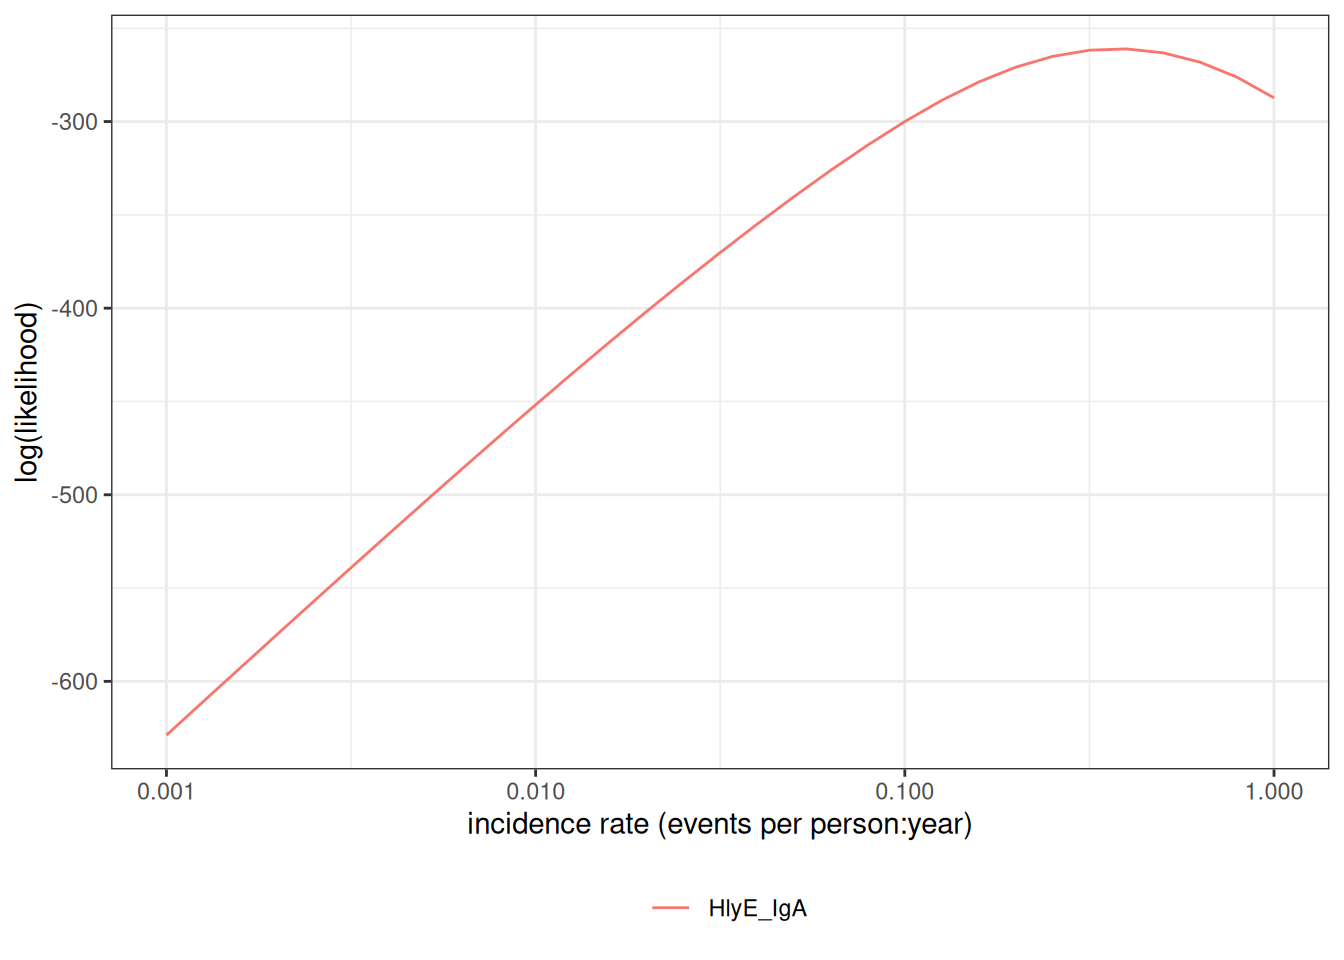
pop_data
|
a data.frame() with cross-sectional serology data by antibody and age, and additional columns
|
curve_params
|
a data.frame() containing MCMC samples of parameters from the Bayesian posterior distribution of a longitudinal decay curve model. The parameter columns must be named:
-
antigen_iso: a character() vector indicating antigen-isotype combinations
-
iter: an integer() vector indicating MCMC sampling iterations
-
y0: baseline antibody level at $t=0$ ($y(t=0)$)
-
y1: antibody peak level (ELISA units)
-
t1: duration of infection
-
alpha: antibody decay rate (1/days for the current longitudinal parameter sets)
-
r: shape factor of antibody decay
|
noise_params
|
a data.frame() (or tibble::tibble()) containing the following variables, specifying noise parameters for each antigen isotype:
-
antigen_iso: antigen isotype whose noise parameters are being specified on each row
-
nu: biological noise
-
eps: measurement noise
-
y.low: lower limit of detection for the current antigen isotype
-
y.high: upper limit of detection for the current antigen isotype
|
antigen_isos
|
Character vector listing one or more antigen isotypes. Values must match pop_data.
|
x
|
sequence of lambda values to graph
|
highlight_points
|
a possible highlighted value
|
highlight_point_names
|
labels for highlighted points
|
log_x
|
should the x-axis be on a logarithmic scale (TRUE) or linear scale (FALSE, default)?
|
previous_plot
|
if not NULL, the current data is added to the existing graph
|
curve_label
|
if not NULL, add a label for the curve
|
…
|
Arguments passed on to log_likelihood
-
verbose
-
logical: if TRUE, print verbose log information to console
-
method
-
how to combine several biomarkers into one likelihood:
-
“composite” (the default) sums the per-biomarker marginal log-likelihoods, giving each biomarker its own latent infection time. This is an independence (composite) likelihood: its point estimate is consistent, but its naive standard error assumes biomarker readings from the same person are independent — see cluster_var in est_seroincidence() for the correction.
-
“joint” integrates once per subject over a shared latent infection time, with the per-biomarker densities multiplied inside the integral (conditional independence given the time since infection). This is the model the methodology article describes. It needs pop_data to identify subjects (see ids_varname()) so that each person’s readings can be paired, a noise model (nu > 0 or eps > 0) for every biomarker, and the same posterior draws (iter) for every biomarker, so that a person’s biomarkers are evaluated under one coherent draw.
With a single biomarker the two methods coincide. See issues #637 and #646.
|