autoplot() method for pop_data objects
Usage
# S3 method for class 'pop_data'
autoplot(object, log = FALSE, type = "density", strata = NULL, ...)
Arguments
- object
A
pop_dataobject (fromload_pop_data())- log
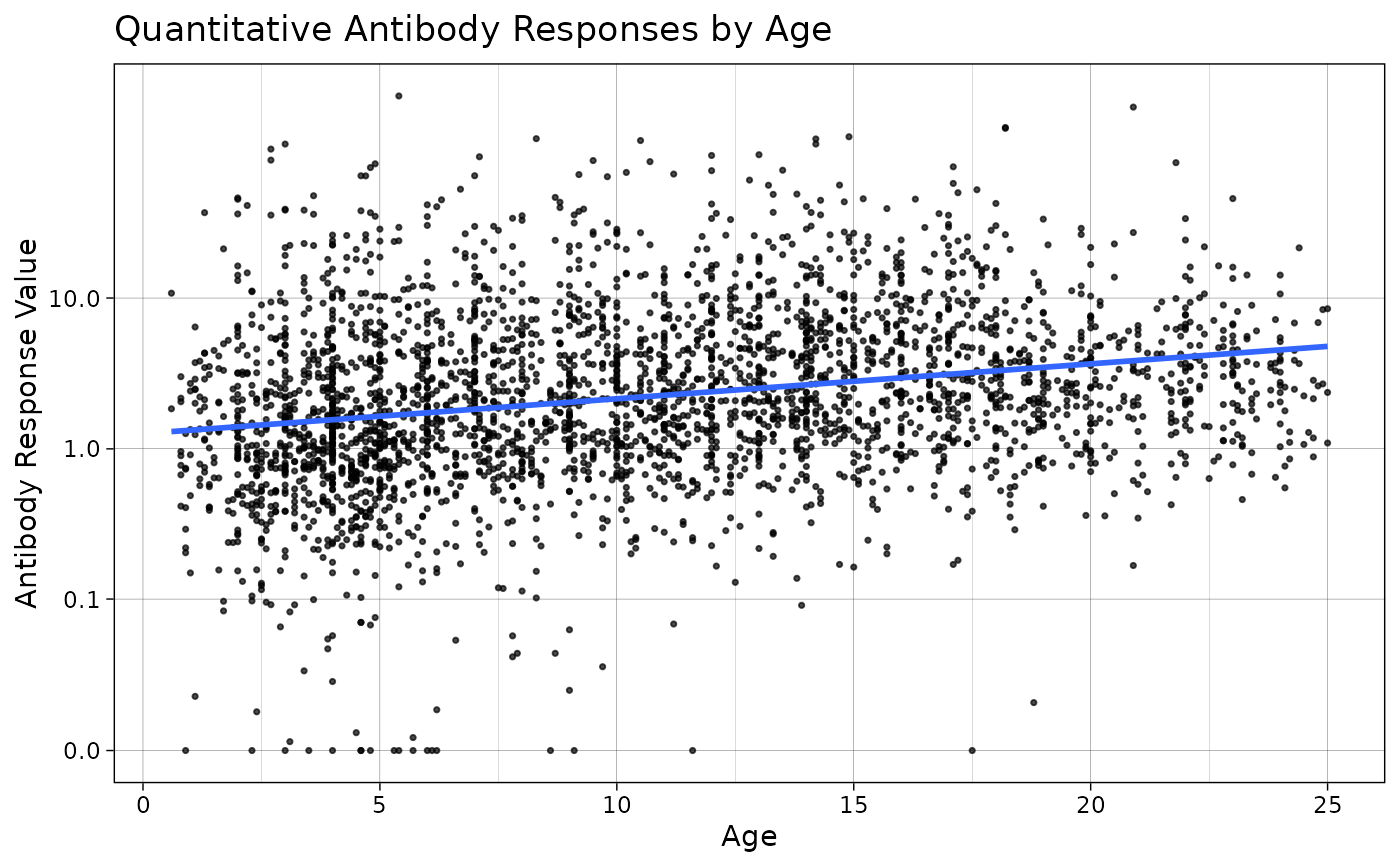
whether to show antibody responses on logarithmic scale
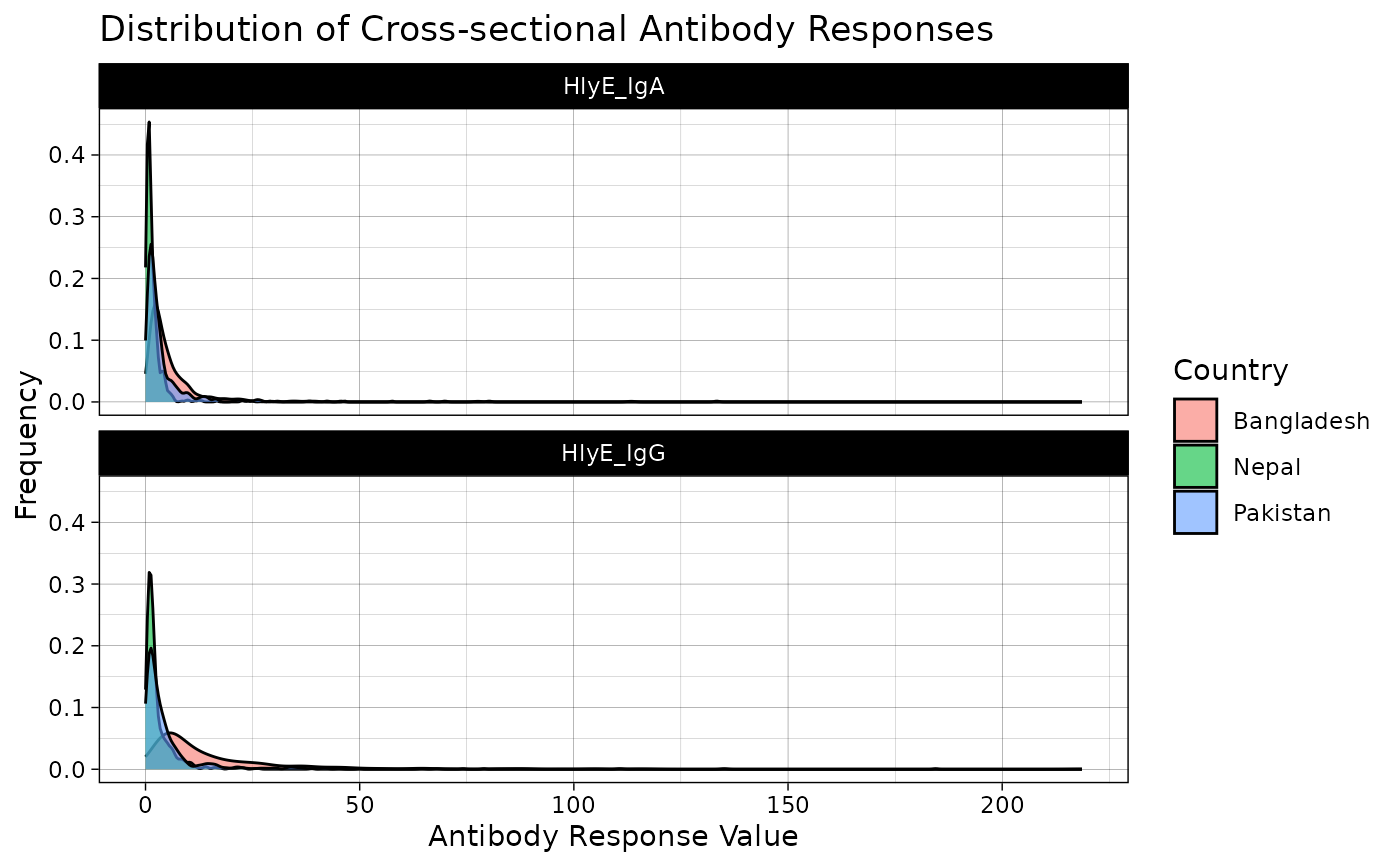
- type
an option to choose type of chart: the current options are
"density"or"age-scatter"- strata
the name of a variable in
pop_datato stratify by (orNULLfor no stratification)- ...
unused
Value
a ggplot2::ggplot object