Plot distribution of antibodies

Description

autoplot() method for pop_data objects

Usage

## S3 method for class 'pop_data'
autoplot(object, log = FALSE, type = "density", strata = NULL, ...)

Arguments

object A pop_data object (from load_pop_data())
log whether to show antibody responses on logarithmic scale
type an option to choose type of chart: the current options are “density” or “age-scatter”
strata the name of a variable in pop_data to stratify by (or NULL for no stratification)
unused

Value

a ggplot2::ggplot object

Examples

Code
library("serocalculator")


library(dplyr)
library(ggplot2)
library(magrittr)

xs_data <-
  serocalculator_example("example_pop_data.csv") |>
  read.csv() |>
  as_pop_data()

xs_data |> autoplot(strata = "catchment", type = "density")
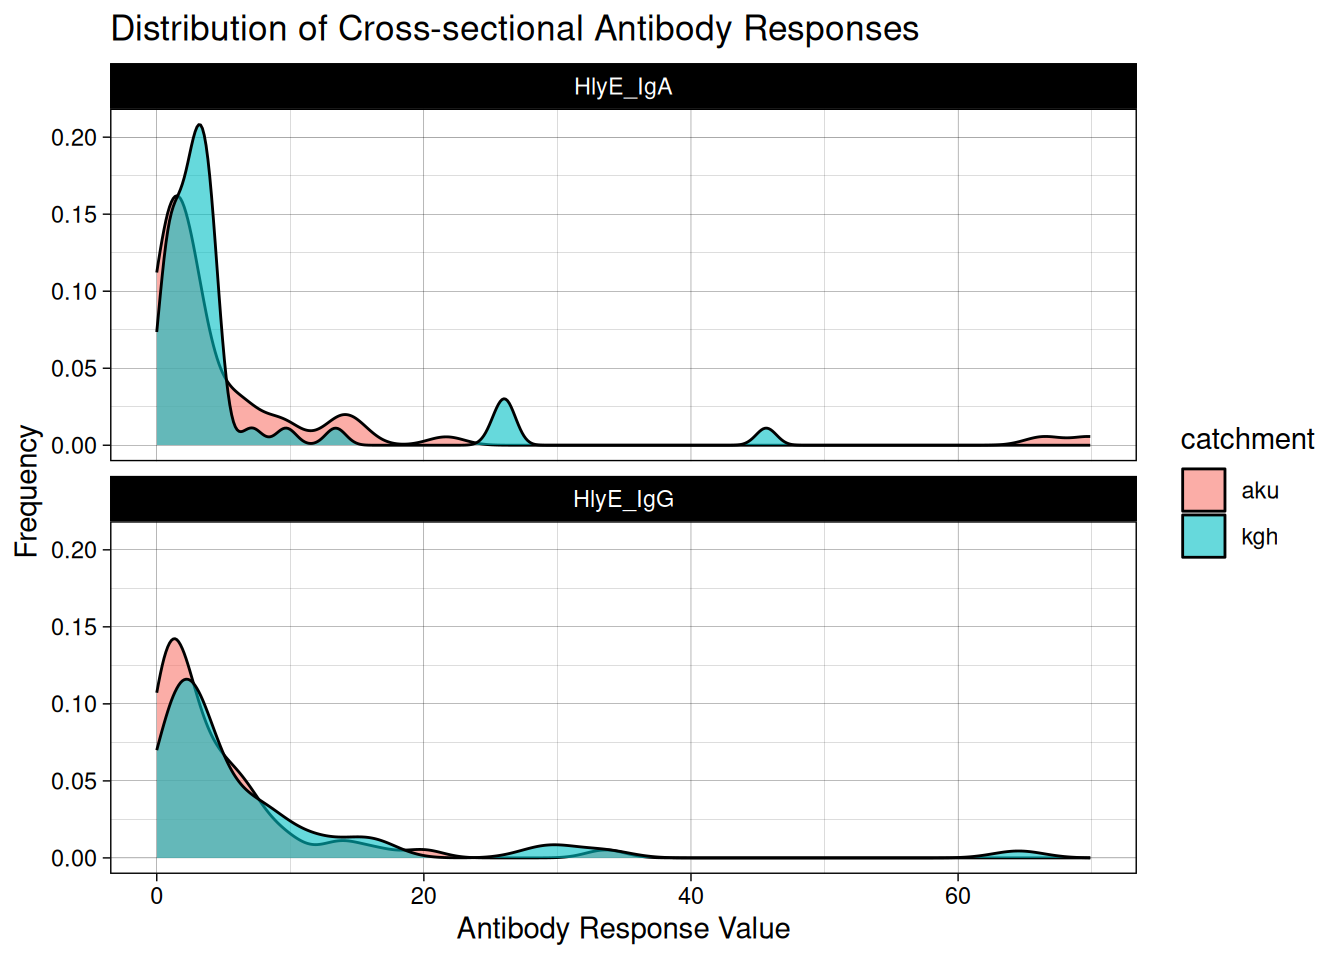
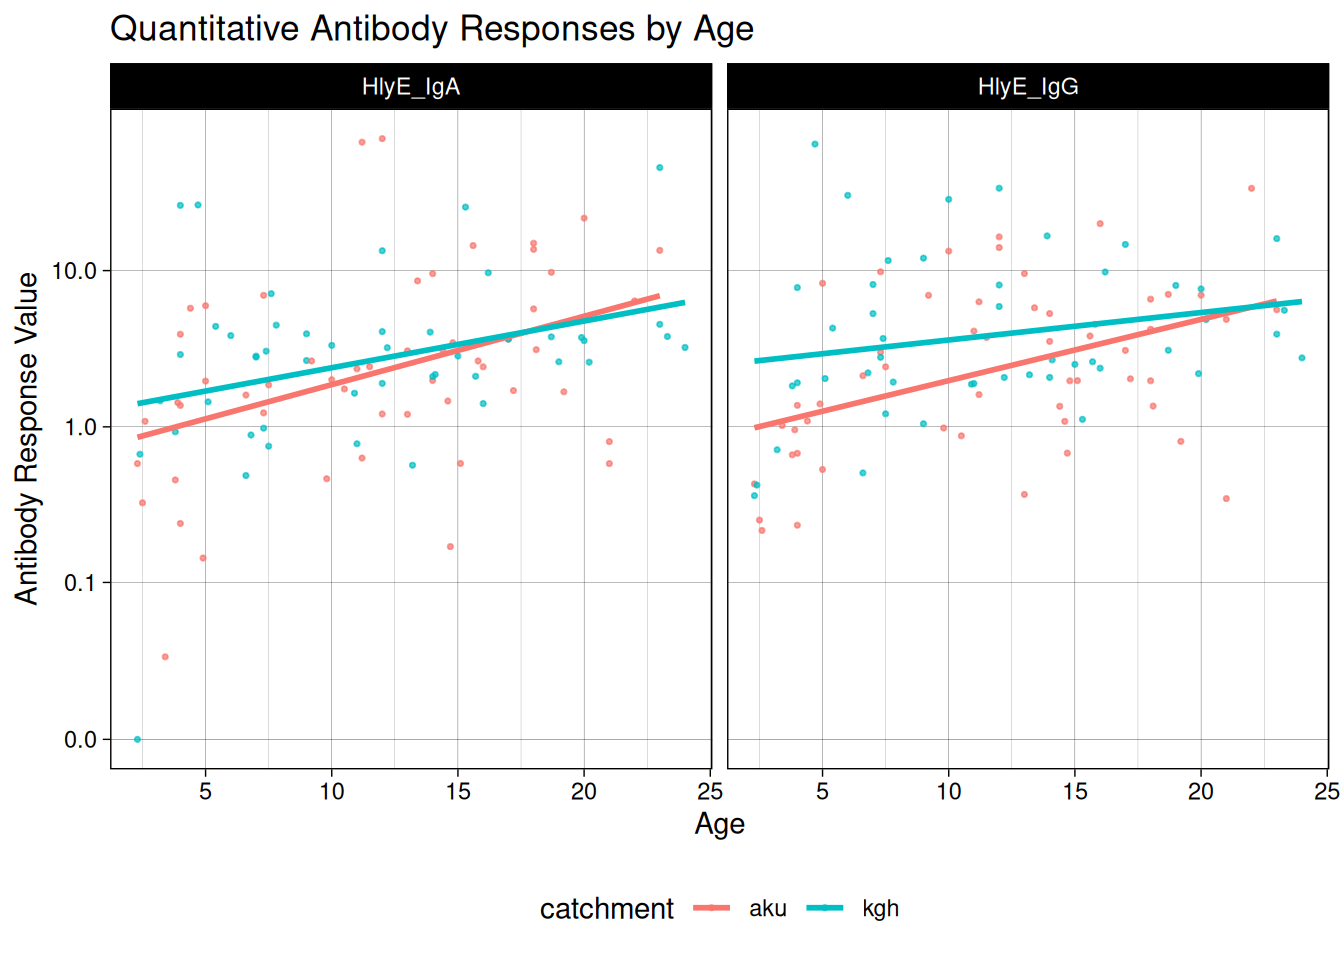
Code
xs_data |> autoplot(strata = "catchment", type = "age-scatter")