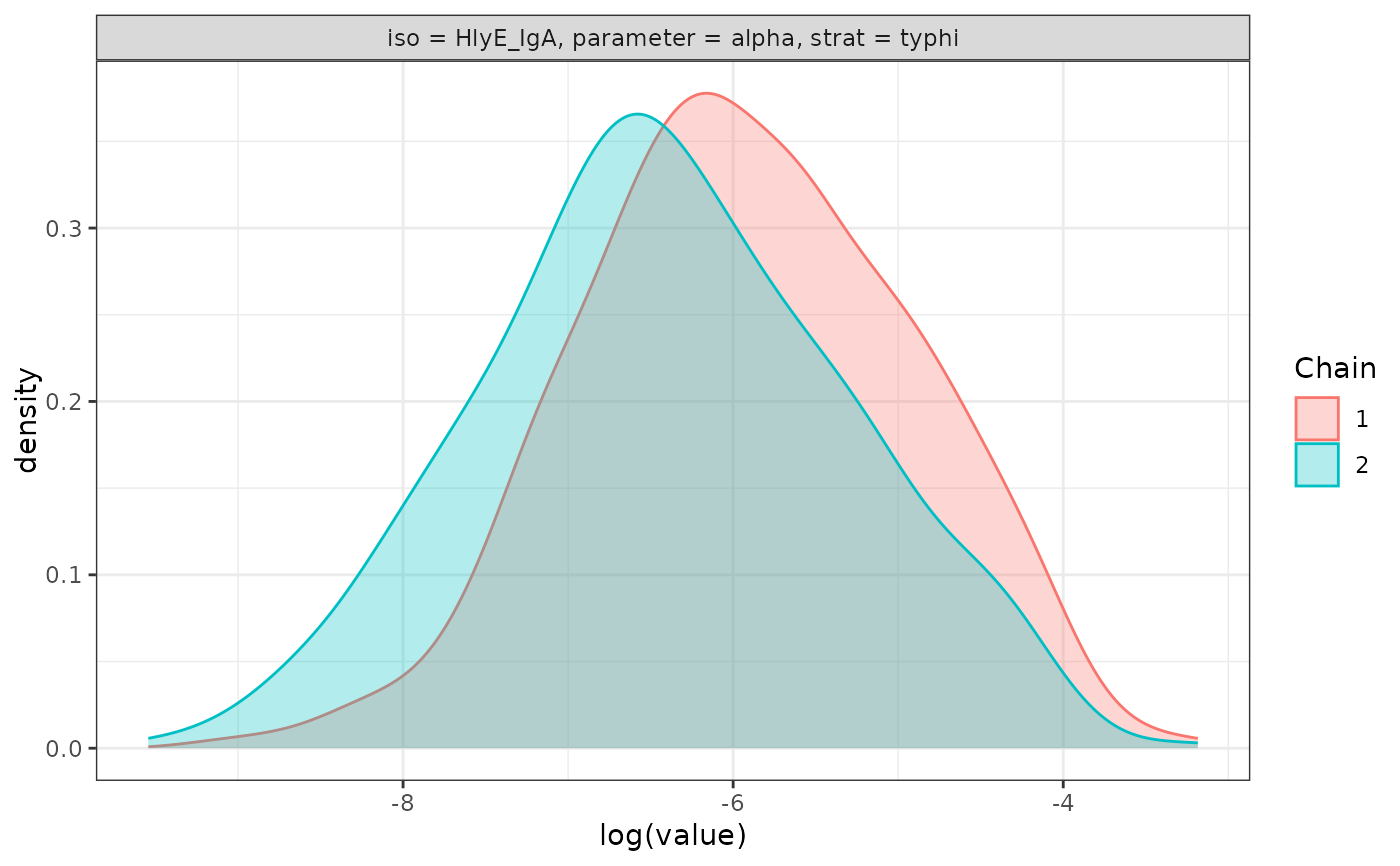
plot_jags_dens() takes a list output from run_mod()
to create density plots for each chain run in the mcmc estimation.
Defaults will produce every combination of antigen/antibody, parameters,
and stratifications, unless otherwise specified.
Antigen/antibody combinations and stratifications will vary by analysis.
The antibody dynamic curve includes the following parameters:
y0 = baseline antibody concentration
y1 = peak antibody concentration
t1 = time to peak
r = shape parameter
alpha = decay rate
Arguments
- data
A list outputted from run_mod().
- iso
Specify character string to produce plots of only a specific antigen/antibody combination, entered with quotes. Default outputs all antigen/antibody combinations.
- param
Specify character string to produce plots of only a specific parameter, entered with quotes. Options include:
alpha= posterior estimate of decay rater= posterior estimate of shape parametert1= posterior estimate of time to peaky0= posterior estimate of baseline antibody concentrationy1= posterior estimate of peak antibody concentration
- strat
Specify character string to produce plots of specific stratification entered in quotes.
Value
A base::list() of ggplot2::ggplot() objects producing density
plots for all the specified input.
Examples
data <- serodynamics::nepal_sees_jags_output

# Specifying isotype and stratification for traceplot.
plot_jags_dens(
               data = data,
               iso = "HlyE_IgA",
               strat = "typhi")
#> $typhi
#> $typhi$HlyE_IgA

#>
#>
#>
#>