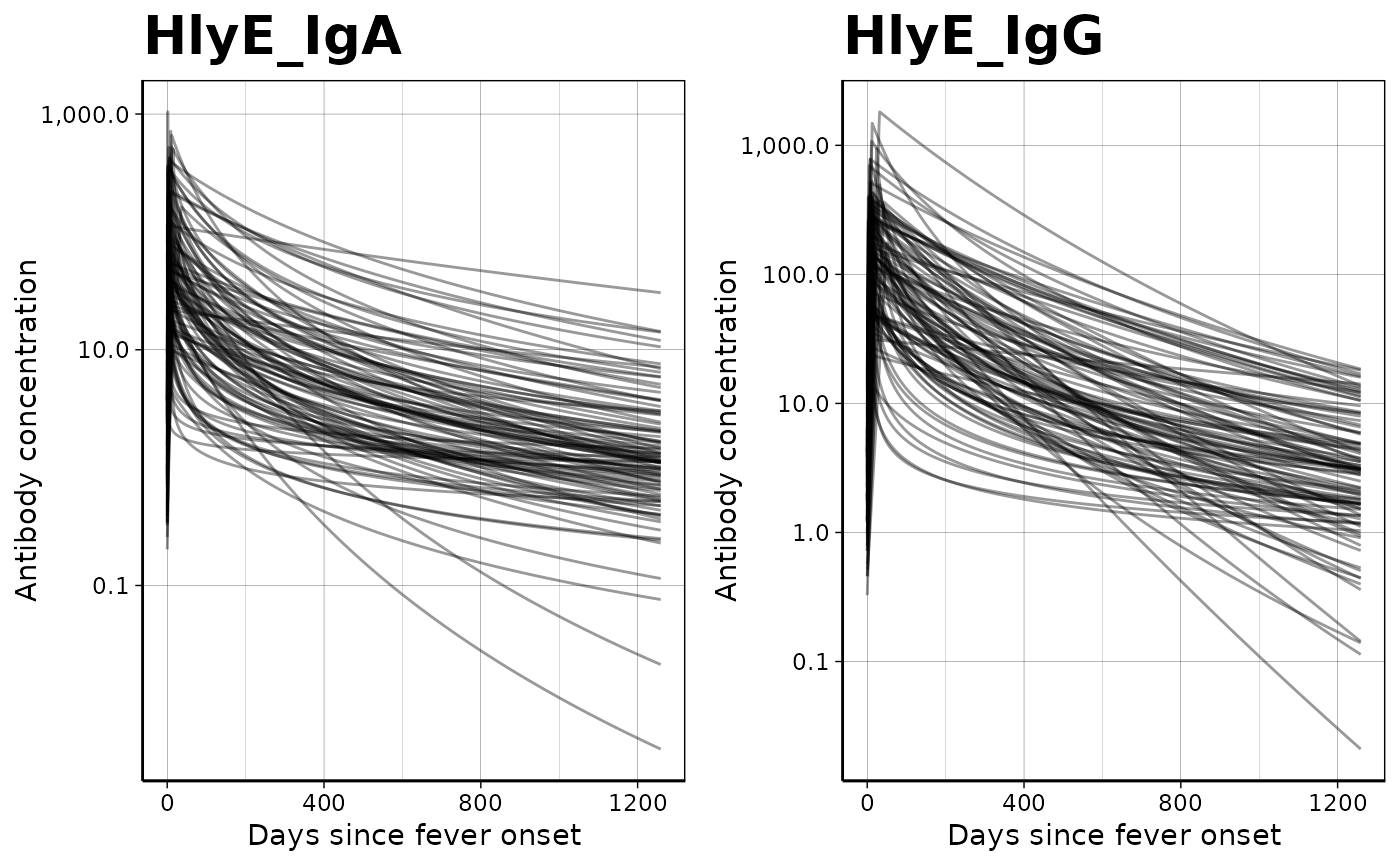
Graph antibody decay curves by antigen isotype
Source:R/autoplot.curve_params.R
autoplot.curve_params.RdGraph antibody decay curves by antigen isotype
Arguments
- object
a
curve_paramsobject (constructed usingas_sr_params()), which is adata.frame()containing MCMC samples of antibody decay curve parameters- method
-
a character string indicating whether to use
graph.curve.params()(default) orgraph_seroresponse_model_1()(previous default) as the graphing method.
- ...
additional arguments passed to the sub-function indicated by the
methodargument.
Value
a ggplot2::ggplot() object
Details
Currently, the backend for this method is graph.curve.params().
Previously, the backend for this method was graph_seroresponse_model_1().
That function is still available if preferred.
Examples
# \donttest{
library(dplyr)
#>
#> Attaching package: ‘dplyr’
#> The following objects are masked from ‘package:stats’:
#>
#>     filter, lag
#> The following objects are masked from ‘package:base’:
#>
#>     intersect, setdiff, setequal, union
library(ggplot2)
library(magrittr)

curve <-
  serocalculator_example("example_curve_params.csv") |>
  read.csv() |>
  as_sr_params() |>
  filter(antigen_iso %in% c("HlyE_IgA", "HlyE_IgG")) |>
  autoplot()

curve

# }
# }