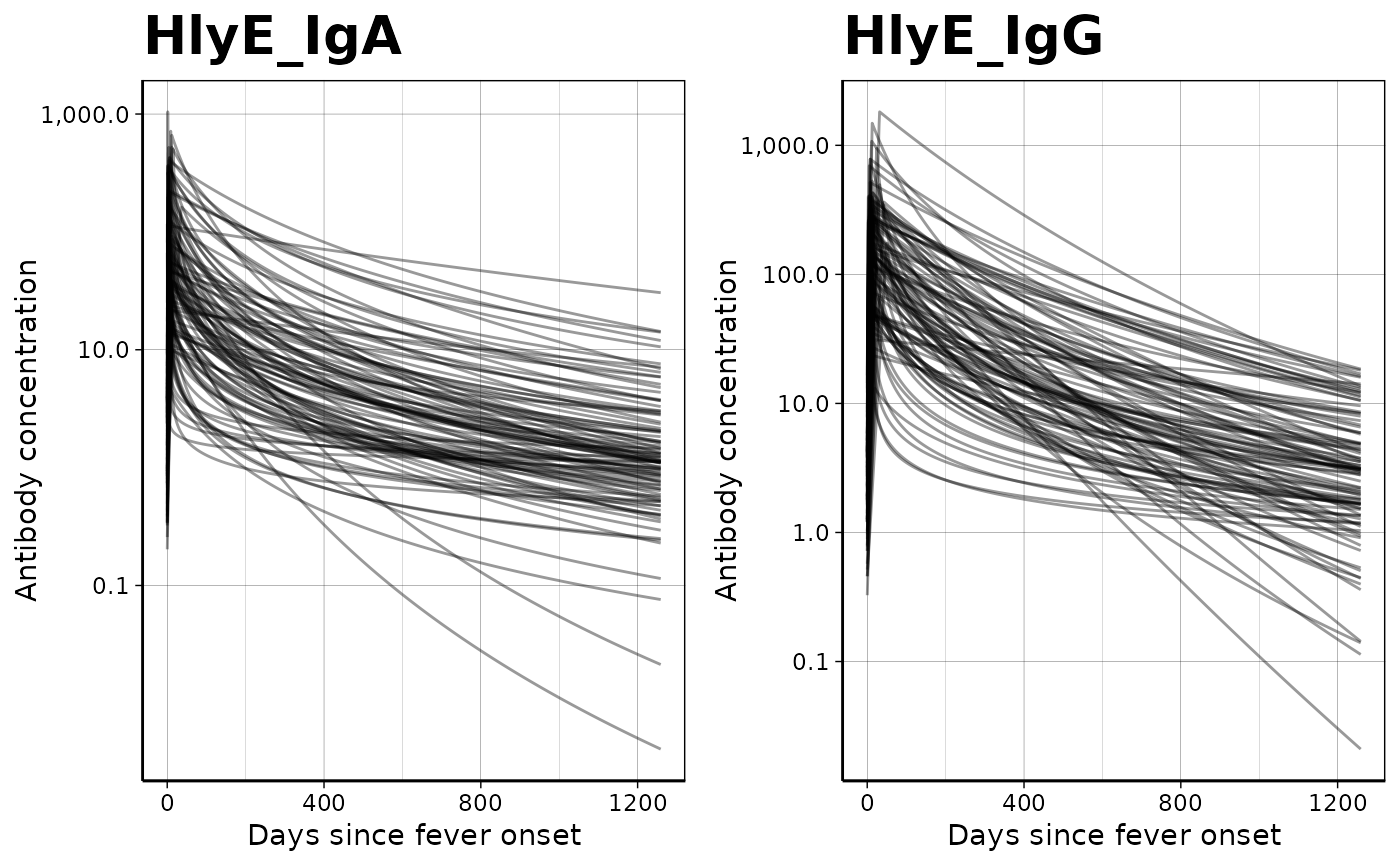
graph antibody decay curves by antigen isotype
Source:R/graph_seroresponse_model_1.R
graph_seroresponse_model_1.Rdgraph antibody decay curves by antigen isotype
Arguments
- object
a
data.frame()of curve parameters (one or more MCMC samples)- antigen_isos
antigen isotypes to analyze (can subset
curve_params)- ncol
how many columns of subfigures to use in panel plot
- ...
-
Arguments passed on to
plot_curve_params_one_abverboseverbose output
xlimrange of x values to graph
n_curveshow many curves to plot (see details).
n_pointsNumber of points to interpolate along the x axis (passed to
ggplot2::geom_function())iters_to_graphwhich MCMC iterations in
curve_paramsto plot (overridesn_curves).alpha-
(passed to
ggplot2::geom_function()) how transparent the curves should be:0 = fully transparent (invisible)
1 = fully opaque
log_xshould the x-axis be on a logarithmic scale (
TRUE) or linear scale (FALSE, default)?log_yshould the Y-axis be on a logarithmic scale (default,
TRUE) or linear scale (FALSE)?
Value
a ggplot2::ggplot() object
Details
iters_to_graph
If you directly specify iters_to_graph when calling this function,
the row numbers are enumerated separately for each antigen isotype;
in other words, for the purposes of this argument,
row numbers start over at 1 for each antigen isotype.
There is currently no way to specify different row numbers
for different antigen isotypes;
if you want to do that,
you will could call plot_curve_params_one_ab() directly
for each antigen isotype
and combine the resulting panels yourself.
Or you could subset curve_params manually,
before passing it to this function,
and set the n_curves argument to Inf.