Graph estimated antibody decay curves
Arguments
- object
a
data.frame()containing MCMC samples of antibody decay curve parameters- antigen_isos
antigen isotypes to analyze (can subset
object)- verbose
verbose output
- quantiles
Optional numeric vector of point-wise (over time) quantiles to plot (e.g., 10%, 50%, and 90% =
c(0.1, 0.5, 0.9)). IfNULL, no quantile lines are shown.- alpha_samples
alphaparameter passed to ggplot2::geom_line (has no effect ifiters_to_graphis empty)- chain_color
logical: if TRUE (default), MCMC chain lines are colored by chain. If FALSE, all MCMC chain lines are black.
- log_x
should the x-axis be on a logarithmic scale (
TRUE) or linear scale (FALSE, default)?- log_y
should the Y-axis be on a logarithmic scale (default,
TRUE) or linear scale (FALSE)?- n_curves
how many curves to plot (see details).
- iters_to_graph
which MCMC iterations in
curve_paramsto plot (overridesn_curves).- ...
not currently used
Value
a ggplot2::ggplot() object showing the antibody dynamic
kinetics of selected antigen/isotype combinations, with optional posterior
distribution quantile curves.
Details
n_curves and iters_to_graph
In most cases, object will contain too many rows of MCMC
samples for all of these samples to be plotted at once.
Setting the
n_curvesargument to a value smaller than the number of rows incurve_paramswill cause this function to select the firstn_curvesrows to graph.Setting
n_curveslarger than the number of rows in ` will result all curves being plotted.If the user directly specifies the
iters_to_graphargument, thenn_curveshas no effect.
Examples
# Load example dataset
curve <- typhoid_curves_nostrat_100 |>
dplyr::filter(antigen_iso %in% c("HlyE_IgA", "HlyE_IgG"))
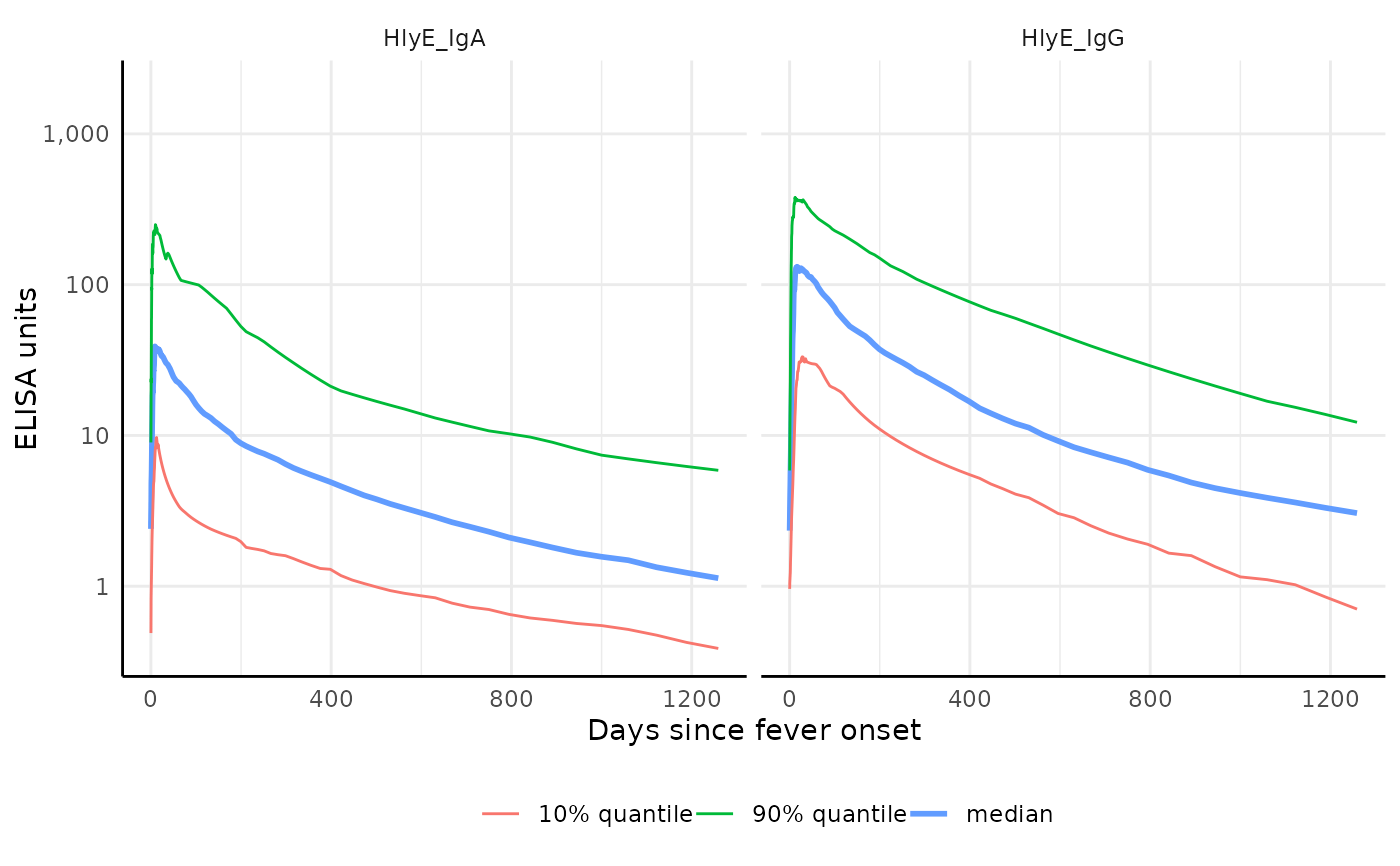
# Plot quantiles without showing all curves
plot1 <- graph.curve.params(curve, n_curves = 0)
print(plot1)
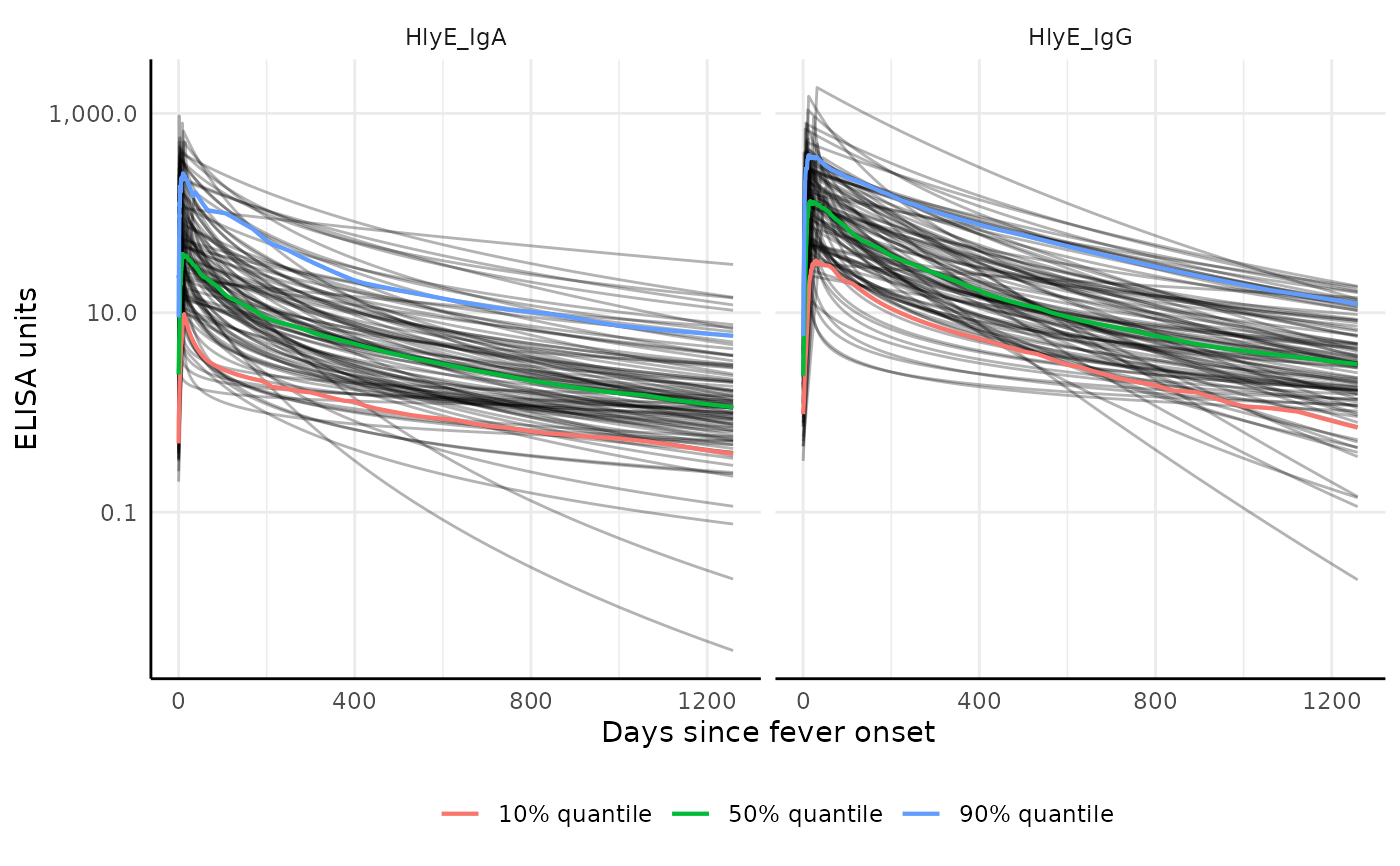
 # Plot with additional quantiles and show all curves
plot2 <- graph.curve.params(
curve,
n_curves = Inf,
quantiles = c(0.1, 0.5, 0.9)
)
print(plot2)
# Plot with additional quantiles and show all curves
plot2 <- graph.curve.params(
curve,
n_curves = Inf,
quantiles = c(0.1, 0.5, 0.9)
)
print(plot2)
 # Plot with MCMC chains in black
plot3 <- graph.curve.params(
curve,
n_curves = Inf,
quantiles = c(0.1, 0.5, 0.9),
chain_color = FALSE
)
print(plot3)
# Plot with MCMC chains in black
plot3 <- graph.curve.params(
curve,
n_curves = Inf,
quantiles = c(0.1, 0.5, 0.9),
chain_color = FALSE
)
print(plot3)