Plot Estimated Serodynamic Curves at Predictive or Population Level
Source:R/plot_serocurve.R
plot_serocurve.RdPlots the estimated antibody response curve derived from posterior samples
of population-level (mu.par) or the predictive distribution from a fitted
run_serodynamics() model. A median curve with an optional 95% credible
interval ribbon is produced for each requested antigen-isotype and
stratification combination.
Arguments
- model
An
sr_modelobject returned byrun_serodynamics().- antigen_iso
A character vector of antigen-isotype combinations to plot. Defaults to all antigen-isotypes present in the subject-level draws of
model(model$Iso_type); in normal usage these match the levels available inattr(model, "population_params").- strat
A character vector of stratification levels to include. Defaults to all stratification levels present in the subject-level draws of
model(model$Stratification); in normal usage these match the levels available inattr(model, "population_params").- param_source
character; which posterior samples to use for the curve. Options:
"predictive"(default): uses the predictive distribution for a new individual drawn from the population-level prior."population": uses population-levelmu.parsamples stored inattr(model, "population_params"). Requires the model to have been fitted withrun_serodynamics(..., with_pop_params = TRUE).
- show_ci
logical; if TRUE (default), draws a 95% credible interval ribbon around the median curve.
- log_y
logical; if TRUE, applies a log10 transformation to the y-axis.
- log_x
logical; if TRUE, applies a log10 transformation to the x-axis.
- xlim
(Optional) A numeric vector of length 2 providing custom x-axis limits.
- facet_by_strat
logical; if TRUE, facets the plot by stratification level. When FALSE (default), different stratification levels are shown as different colours on the same panel.
- ...
Arguments passed on to
add_serocurve_facets
Value
A ggplot2::ggplot object.
Examples
# nepal_sees_jags_output already includes population_params
model <- serodynamics::nepal_sees_jags_output
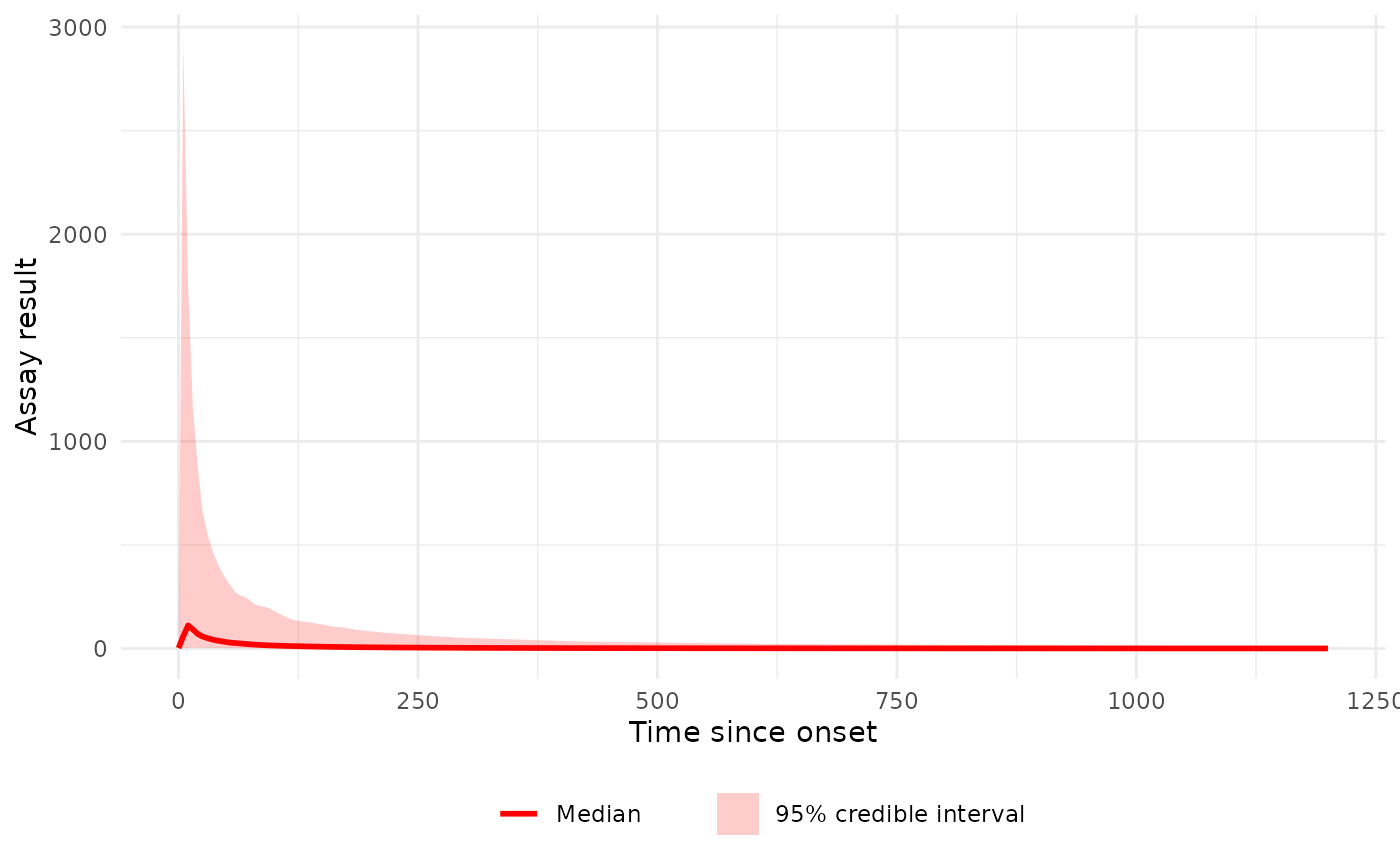
# Predictive curve for a single antigen-isotype and stratum
p1 <- plot_serocurve(
model = model,
antigen_iso = "HlyE_IgA",
strat = "typhi"
)
print(p1)
 # Predictive curves for both stratifications, colored by stratum
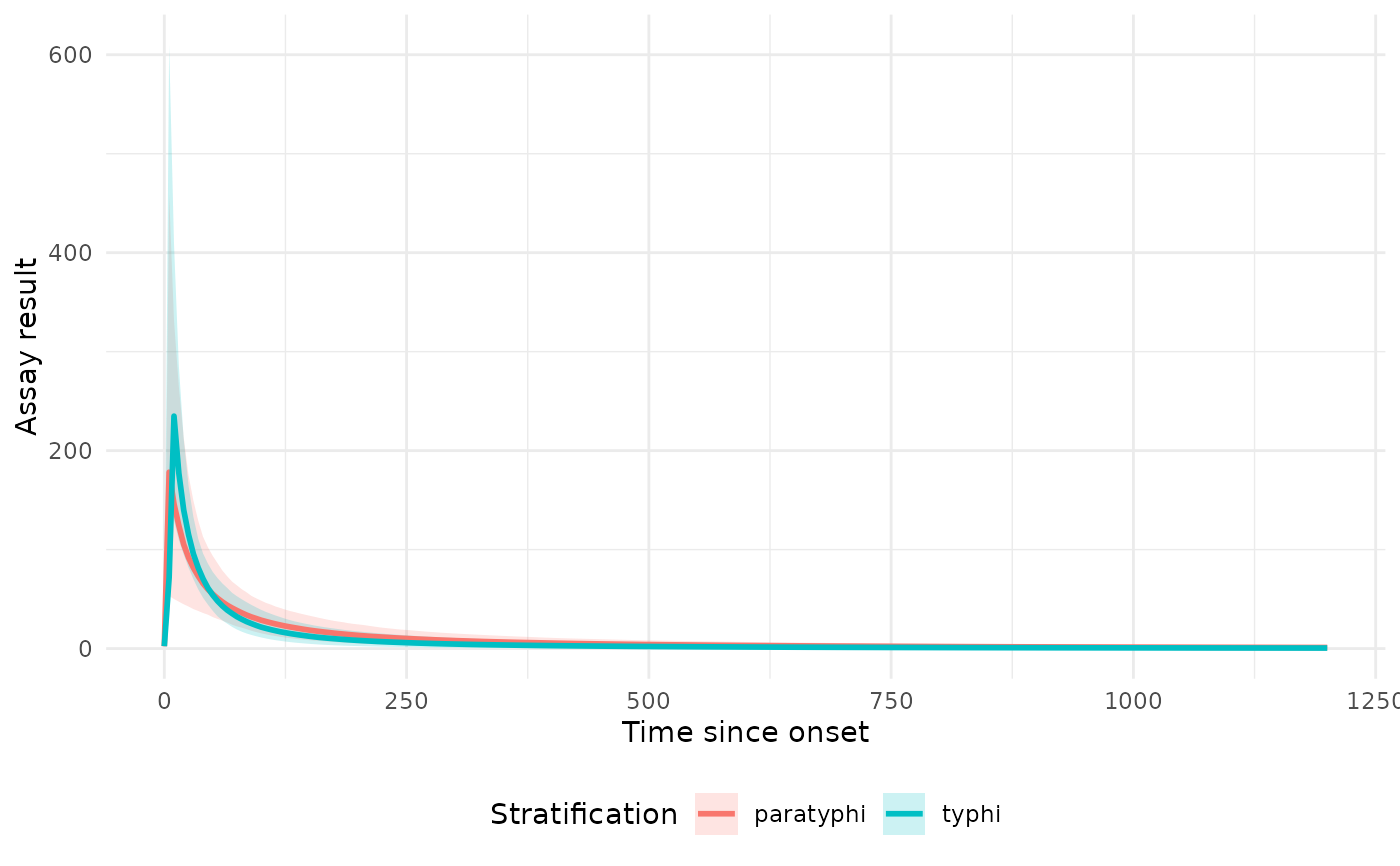
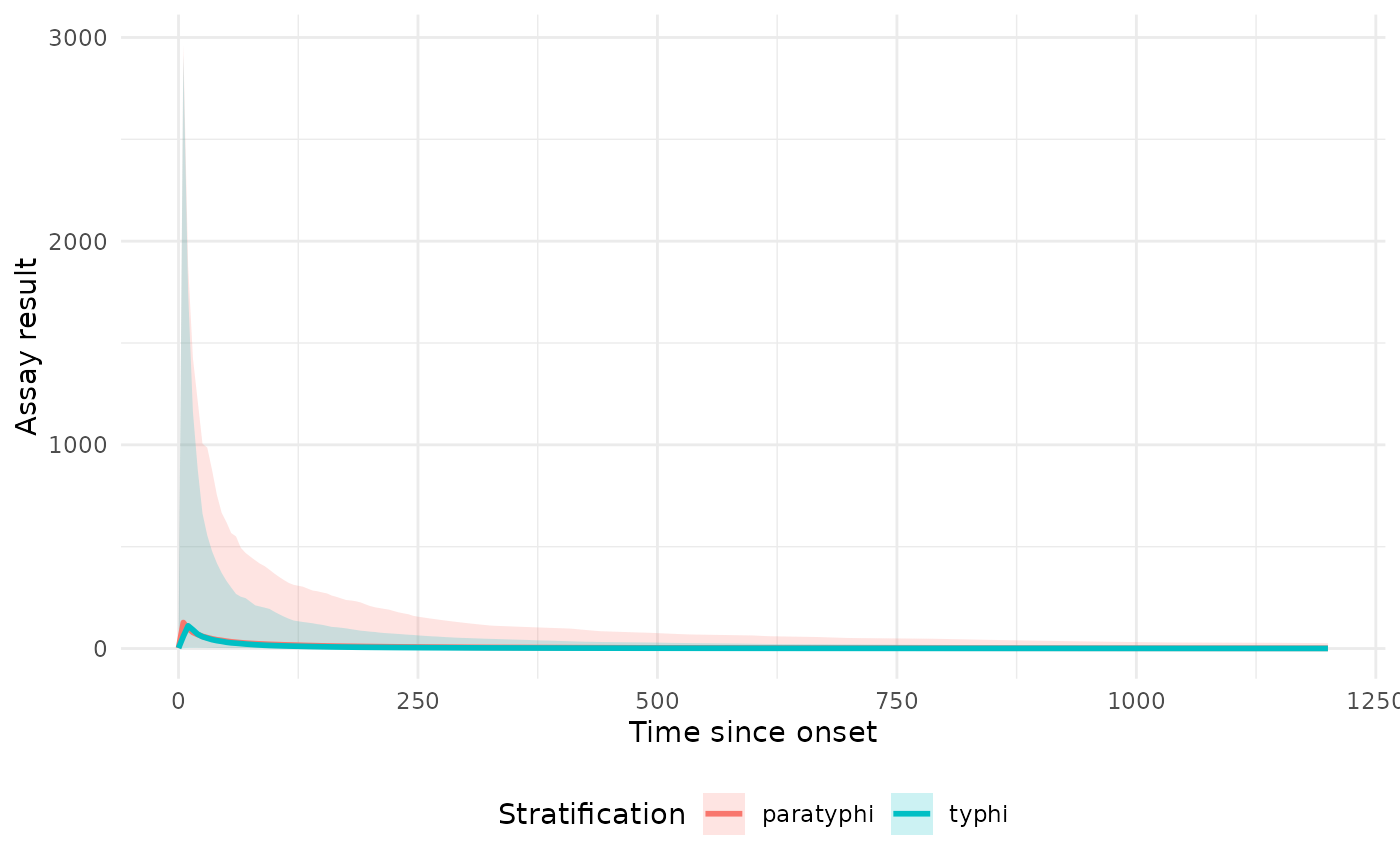
p2 <- plot_serocurve(
model = model,
antigen_iso = "HlyE_IgA"
)
print(p2)
# Predictive curves for both stratifications, colored by stratum
p2 <- plot_serocurve(
model = model,
antigen_iso = "HlyE_IgA"
)
print(p2)
 # Predictive curve faceting by stratification instead of coloring
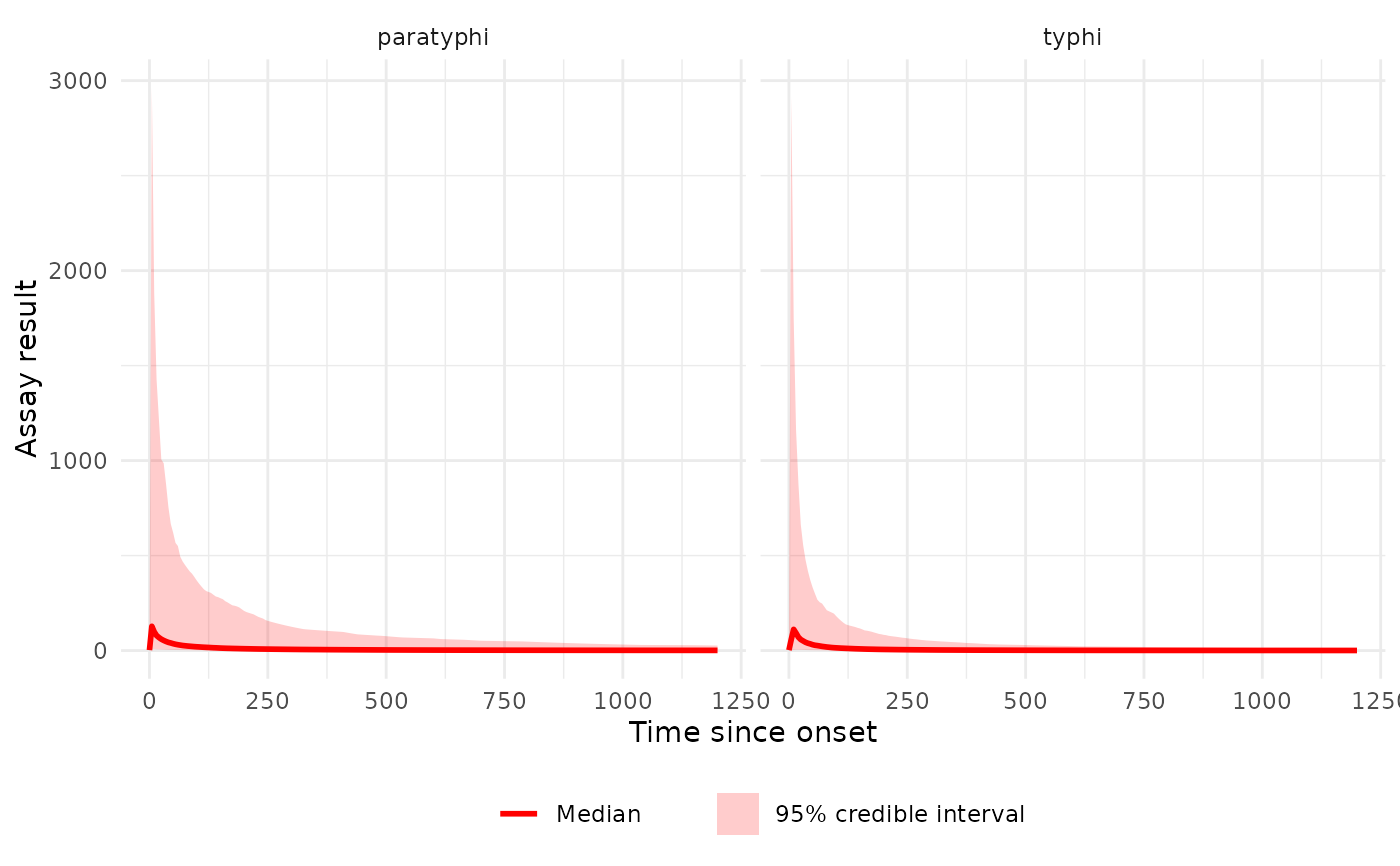
p3 <- plot_serocurve(
model = model,
antigen_iso = "HlyE_IgA",
facet_by_strat = TRUE
)
print(p3)
# Predictive curve faceting by stratification instead of coloring
p3 <- plot_serocurve(
model = model,
antigen_iso = "HlyE_IgA",
facet_by_strat = TRUE
)
print(p3)
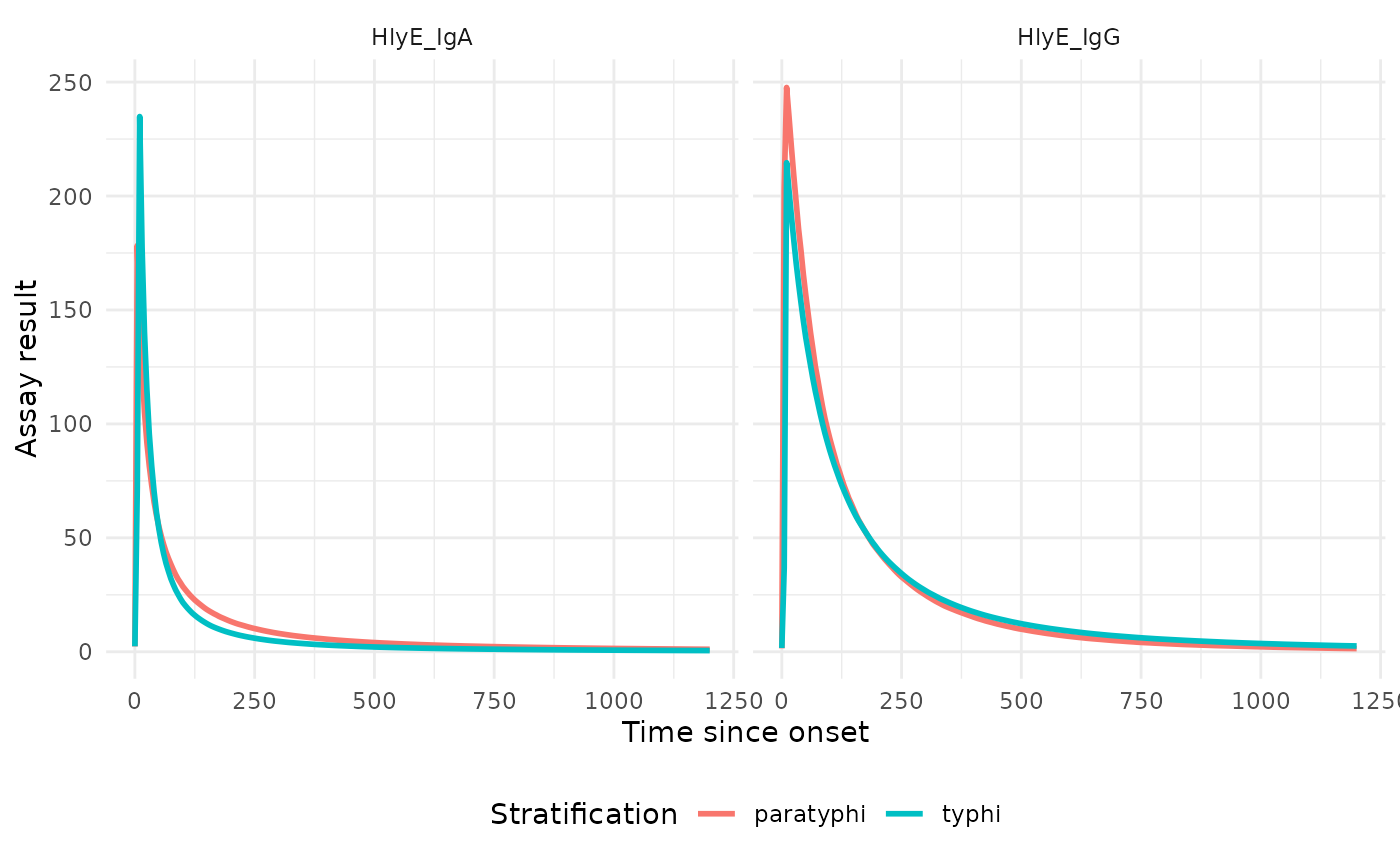
 # Population level curve for multiple antigen-isotypes, faceted, without CI
p4 <- plot_serocurve(
model = model,
antigen_iso = c("HlyE_IgA", "HlyE_IgG"),
param_source = "population",
facet_by_antigen_iso = TRUE,
show_ci = FALSE
)
print(p4)
# Population level curve for multiple antigen-isotypes, faceted, without CI
p4 <- plot_serocurve(
model = model,
antigen_iso = c("HlyE_IgA", "HlyE_IgG"),
param_source = "population",
facet_by_antigen_iso = TRUE,
show_ci = FALSE
)
print(p4)
 # Population level distribution
p5 <- plot_serocurve(
model = model,
antigen_iso = "HlyE_IgA",
param_source = "population"
)
print(p5)
# Population level distribution
p5 <- plot_serocurve(
model = model,
antigen_iso = "HlyE_IgA",
param_source = "population"
)
print(p5)