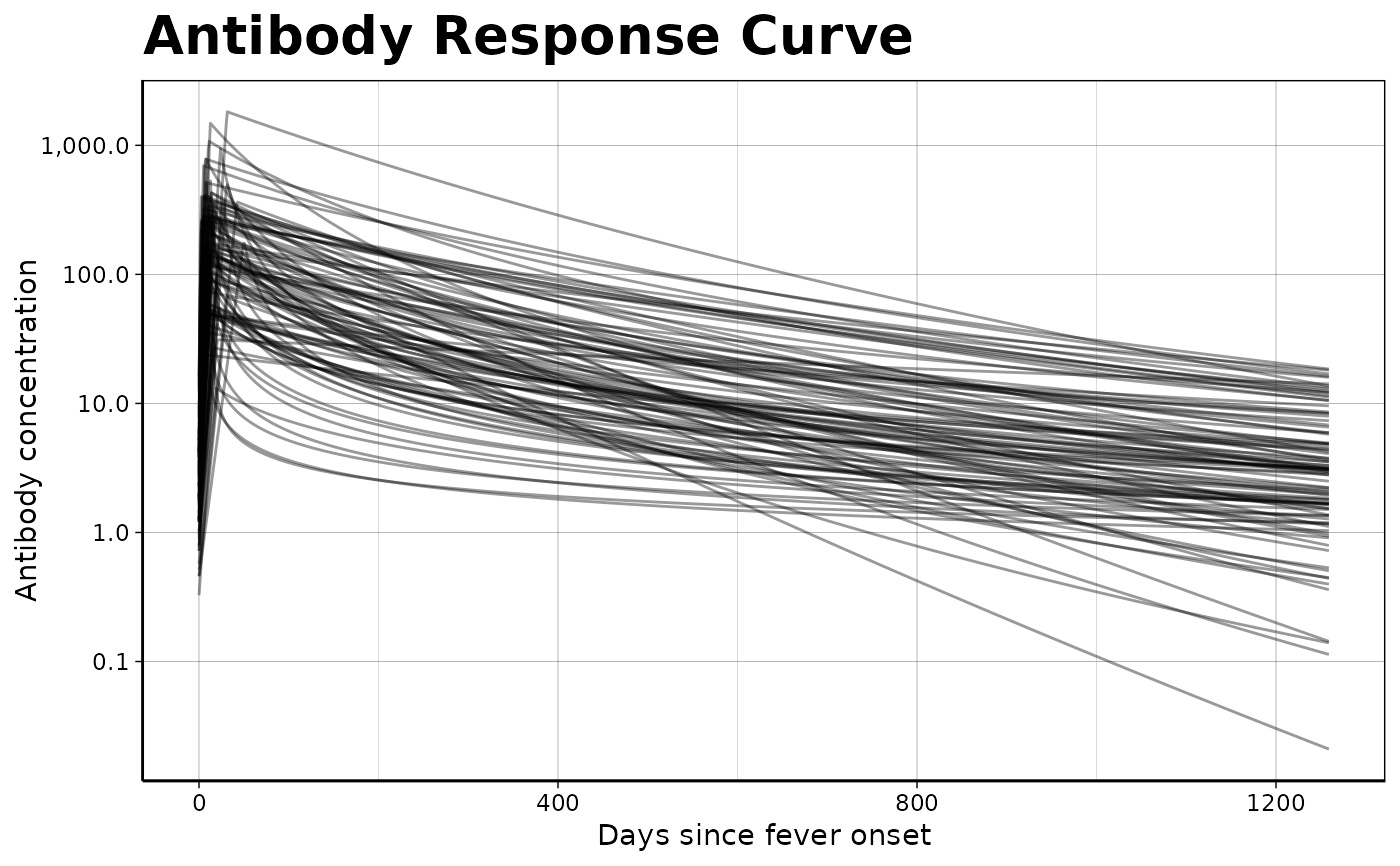
Graph an antibody decay curve model
Source:R/plot_curve_params_one_ab.R
plot_curve_params_one_ab.RdGraph an antibody decay curve model
Arguments
- object
a
data.frame()of curve parameters (one or more MCMC samples)- verbose
verbose output
- alpha
-
(passed to
ggplot2::geom_function()) how transparent the curves should be:0 = fully transparent (invisible)
1 = fully opaque
- n_curves
how many curves to plot (see details).
- n_points
Number of points to interpolate along the x axis (passed to
ggplot2::geom_function())- log_x
should the x-axis be on a logarithmic scale (
TRUE) or linear scale (FALSE, default)?- log_y
should the Y-axis be on a logarithmic scale (default,
TRUE) or linear scale (FALSE)?- iters_to_graph
which MCMC iterations in
curve_paramsto plot (overridesn_curves).- xlim
range of x values to graph
- ...
-
Arguments passed on to
ggplot2::geom_functionmappingSet of aesthetic mappings created by
aes(). If specified andinherit.aes = TRUE(the default), it is combined with the default mapping at the top level of the plot. You must supplymappingif there is no plot mapping.dataIgnored by
stat_function(), do not use.stat-
The statistical transformation to use on the data for this layer. When using a
geom_*()function to construct a layer, thestatargument can be used to override the default coupling between geoms and stats. Thestatargument accepts the following:A
Statggproto subclass, for exampleStatCount.A string naming the stat. To give the stat as a string, strip the function name of the
stat_prefix. For example, to usestat_count(), give the stat as"count".For more information and other ways to specify the stat, see the layer stat documentation.
position-
A position adjustment to use on the data for this layer. This can be used in various ways, including to prevent overplotting and improving the display. The
positionargument accepts the following:The result of calling a position function, such as
position_jitter(). This method allows for passing extra arguments to the position.A string naming the position adjustment. To give the position as a string, strip the function name of the
position_prefix. For example, to useposition_jitter(), give the position as"jitter".For more information and other ways to specify the position, see the layer position documentation.
arrowArrow specification, as created by
grid::arrow().arrow.fillfill colour to use for the arrow head (if closed).
NULLmeans usecolouraesthetic.lineendLine end style (round, butt, square).
linejoinLine join style (round, mitre, bevel).
linemitreLine mitre limit (number greater than 1).
na.rmIf
FALSE, the default, missing values are removed with a warning. IfTRUE, missing values are silently removed.show.legendlogical. Should this layer be included in the legends?
NA, the default, includes if any aesthetics are mapped.FALSEnever includes, andTRUEalways includes. It can also be a named logical vector to finely select the aesthetics to display. To include legend keys for all levels, even when no data exists, useTRUE. IfNA, all levels are shown in legend, but unobserved levels are omitted.inherit.aesIf
FALSE, overrides the default aesthetics, rather than combining with them. This is most useful for helper functions that define both data and aesthetics and shouldn't inherit behaviour from the default plot specification, e.g.annotation_borders().
Value
a ggplot2::ggplot() object
Details
n_curves and iters_to_graph
In most cases, object will contain too many rows of MCMC
samples for all of these samples to be plotted at once.
Setting the
n_curvesargument to a value smaller than the number of rows incurve_paramswill cause this function to select the firstn_curvesrows to graph.Setting
n_curveslarger than the number of rows in ` will result all curves being plotted.If the user directly specifies the
iters_to_graphargument, thenn_curveshas no effect.