Plot simulation results autoplot() method for sim_results objects
Source: R/autoplot.sim_results.R
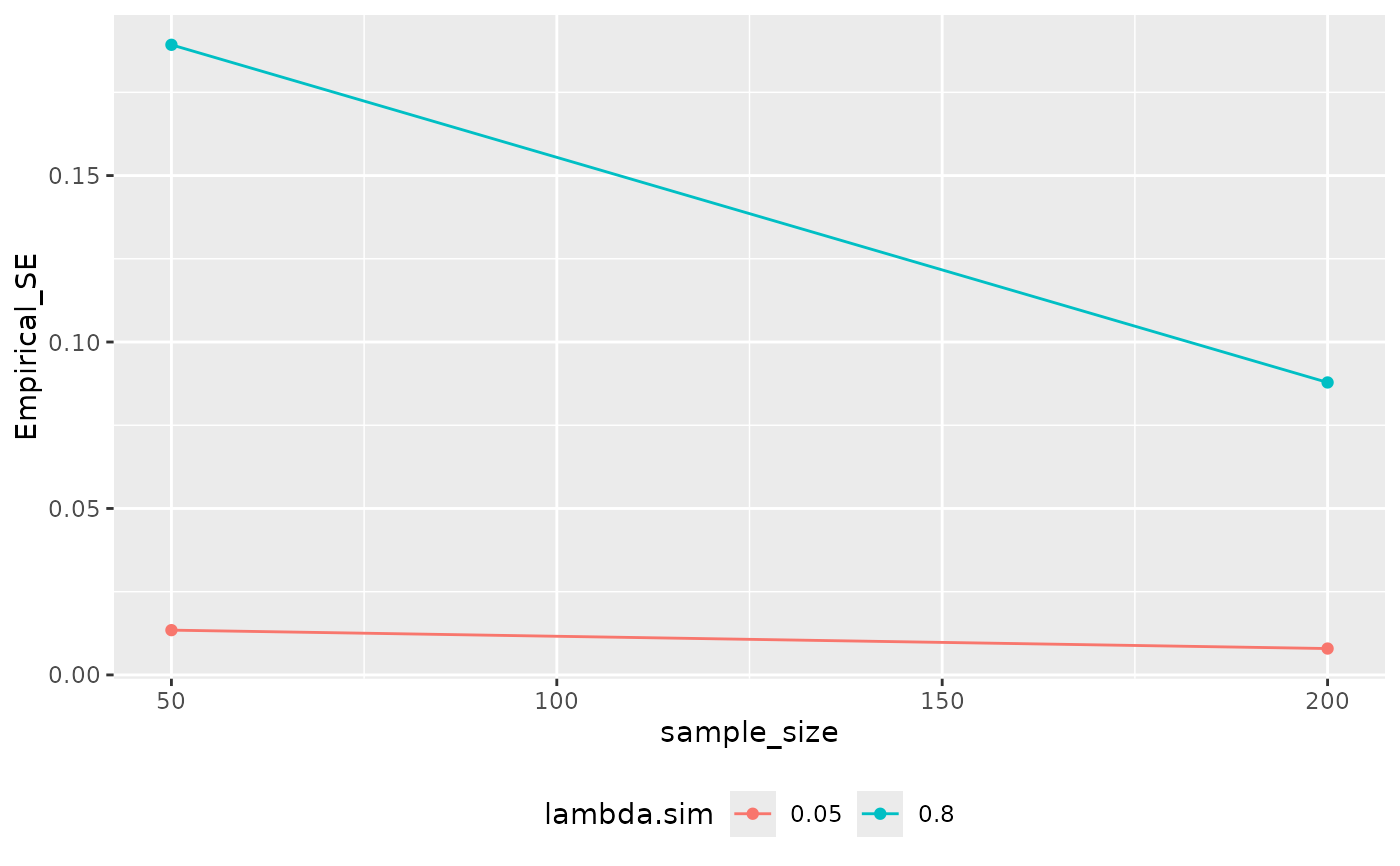
autoplot.sim_results.RdPlot simulation results
autoplot() method for sim_results objects
Usage
# S3 method for class 'sim_results'
autoplot(object, statistic = "Empirical_SE", ...)
Arguments
- object
a
sim_resultsobject (fromanalyze_sims())- statistic
which column of
objectshould be the y-axis?- ...
unused
Examples
# \donttest{
dmcmc <- typhoid_curves_nostrat_100

n_cores <- 2

nclus <- 20
# cross-sectional sample size
nrep <- c(50, 200)

# incidence rate in e
lambdas <- c(.05, .8)
lifespan <- c(0, 10)
antibodies <- c("HlyE_IgA", "HlyE_IgG")
dlims <- rbind(
"HlyE_IgA" = c(min = 0, max = 0.5),
"HlyE_IgG" = c(min = 0, max = 0.5)
)
sim_df <-
sim_pop_data_multi(
n_cores = n_cores,
lambdas = lambdas,
nclus = nclus,
sample_sizes = nrep,
age_range = lifespan,
antigen_isos = antibodies,
renew_params = FALSE,
add_noise = TRUE,
curve_params = dmcmc,
noise_limits = dlims,
format = "long"
)
cond <- tibble::tibble(
antigen_iso = c("HlyE_IgG", "HlyE_IgA"),
nu = c(0.5, 0.5), # Biologic noise (nu)
eps = c(0, 0), # M noise (eps)
y.low = c(1, 1), # low cutoff (llod)
y.high = c(5e6, 5e6)
)
ests <-
est_seroincidence_by(
pop_data = sim_df,
sr_params = dmcmc,
noise_params = cond,
num_cores = n_cores,
strata = c("lambda.sim", "sample_size", "cluster"),
curve_strata_varnames = NULL,
noise_strata_varnames = NULL,
verbose = FALSE,
build_graph = FALSE, # slows down the function substantially
antigen_isos = c("HlyE_IgG", "HlyE_IgA")
)

ests |>
summary() |>
analyze_sims() |>
autoplot()


# }
# }