Graph estimated antibody decay curves
Arguments
- object
a
data.frame()containing MCMC samples of antibody decay curve parameters- antigen_isos
antigen isotypes to analyze (can subset
object)- verbose
verbose output
- quantiles
Optional numeric vector of point-wise (over time) quantiles to plot (e.g., 10%, 50%, and 90% =
c(0.1, 0.5, 0.9)). IfNULL, no quantile lines are shown.- alpha_samples
alphaparameter passed to ggplot2::geom_line (has no effect ifiters_to_graphis empty)- chain_color
logical: if TRUE (default), MCMC chain lines are colored by chain. If FALSE, all MCMC chain lines are black.
- log_x
should the x-axis be on a logarithmic scale (
TRUE) or linear scale (FALSE, default)?- log_y
should the Y-axis be on a logarithmic scale (default,
TRUE) or linear scale (FALSE)?- n_curves
how many curves to plot (see details).
- iters_to_graph
which MCMC iterations in
curve_paramsto plot (overridesn_curves).- ...
not currently used
Value
a ggplot2::ggplot() object showing the antibody dynamic
kinetics of selected antigen/isotype combinations, with optional posterior
distribution quantile curves.
Details
Fixed ... arguments
The arguments fun, n, and args are set internally and cannot be
overridden via .... Passing them will trigger an informative error.
n_curves and iters_to_graph
In most cases, object will contain too many rows of MCMC
samples for all of these samples to be plotted at once.
Setting the
n_curvesargument to a value smaller than the number of rows incurve_paramswill cause this function to select the firstn_curvesrows to graph.Setting
n_curveslarger than the number of rows in ` will result all curves being plotted.If the user directly specifies the
iters_to_graphargument, thenn_curveshas no effect.
Examples
# Load example dataset
curve <- typhoid_curves_nostrat_100 |>
dplyr::filter(antigen_iso %in% c("HlyE_IgA", "HlyE_IgG"))
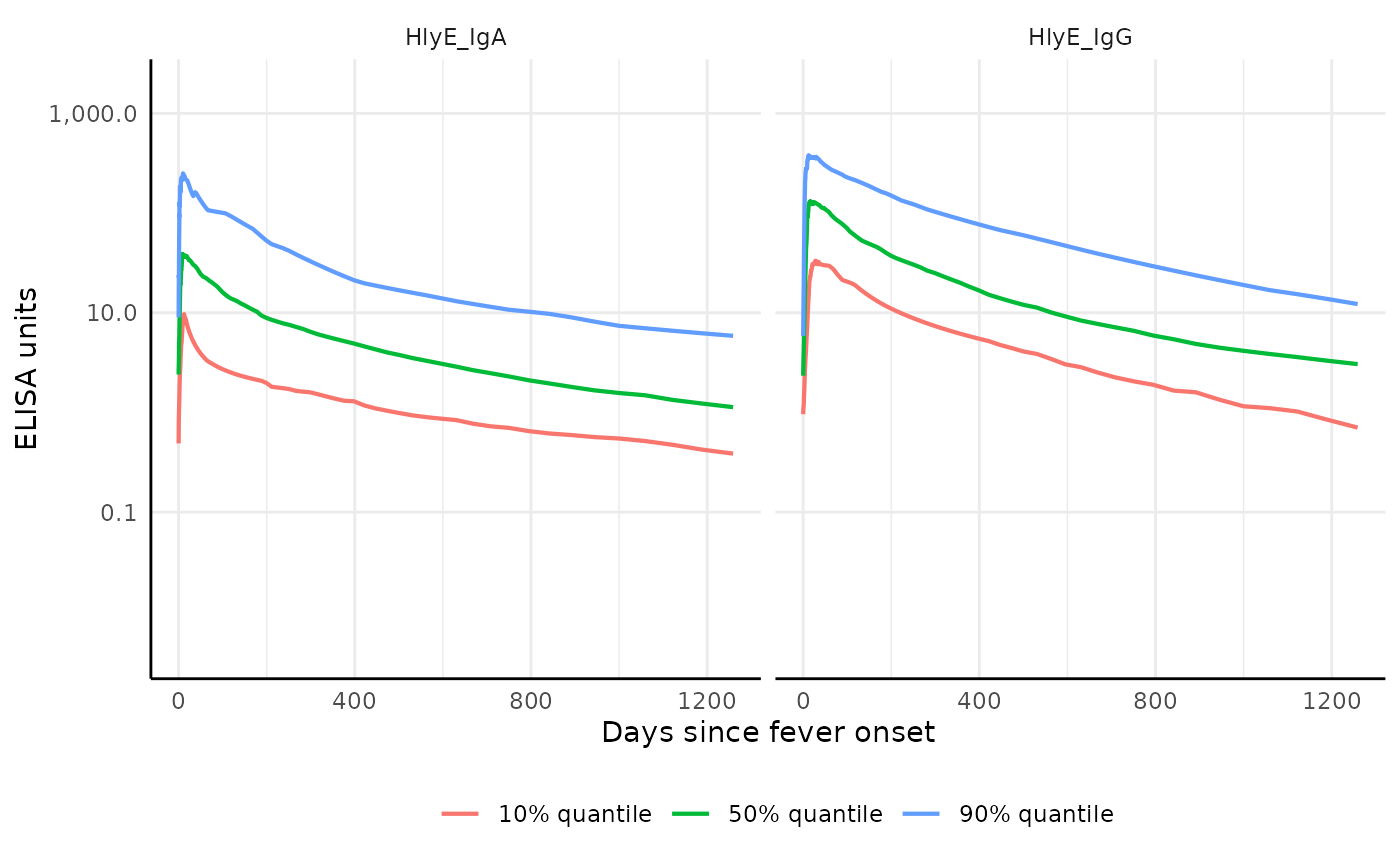
# Plot quantiles without showing all curves
plot1 <- graph.curve.params(curve, n_curves = 0)
print(plot1)
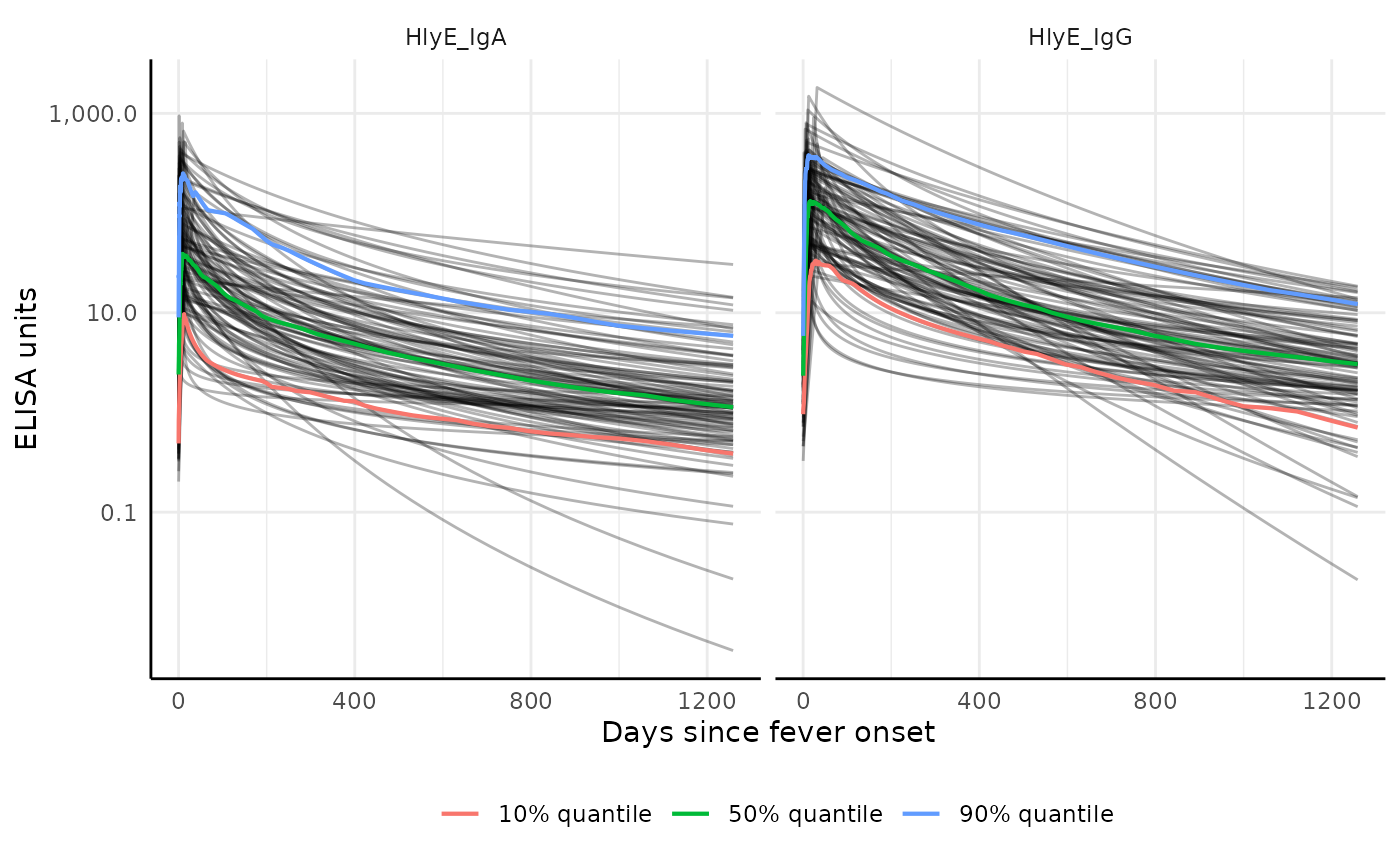
 # Plot with additional quantiles and show all curves
plot2 <- graph.curve.params(
curve,
n_curves = Inf,
quantiles = c(0.1, 0.5, 0.9)
)
print(plot2)
# Plot with additional quantiles and show all curves
plot2 <- graph.curve.params(
curve,
n_curves = Inf,
quantiles = c(0.1, 0.5, 0.9)
)
print(plot2)
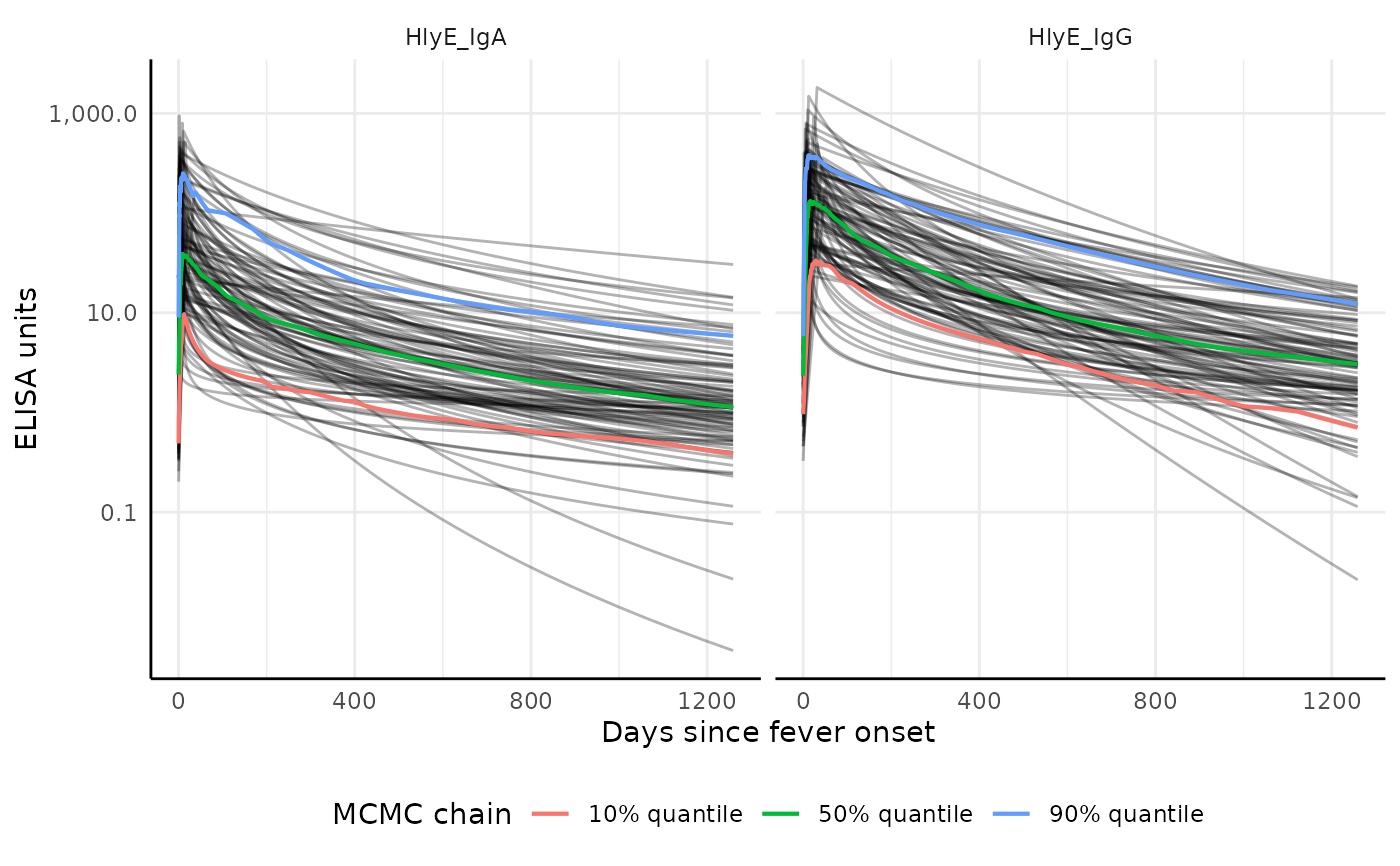 # Plot with MCMC chains in black
plot3 <- graph.curve.params(
curve,
n_curves = Inf,
quantiles = c(0.1, 0.5, 0.9),
chain_color = FALSE
)
print(plot3)
# Plot with MCMC chains in black
plot3 <- graph.curve.params(
curve,
n_curves = Inf,
quantiles = c(0.1, 0.5, 0.9),
chain_color = FALSE
)
print(plot3)